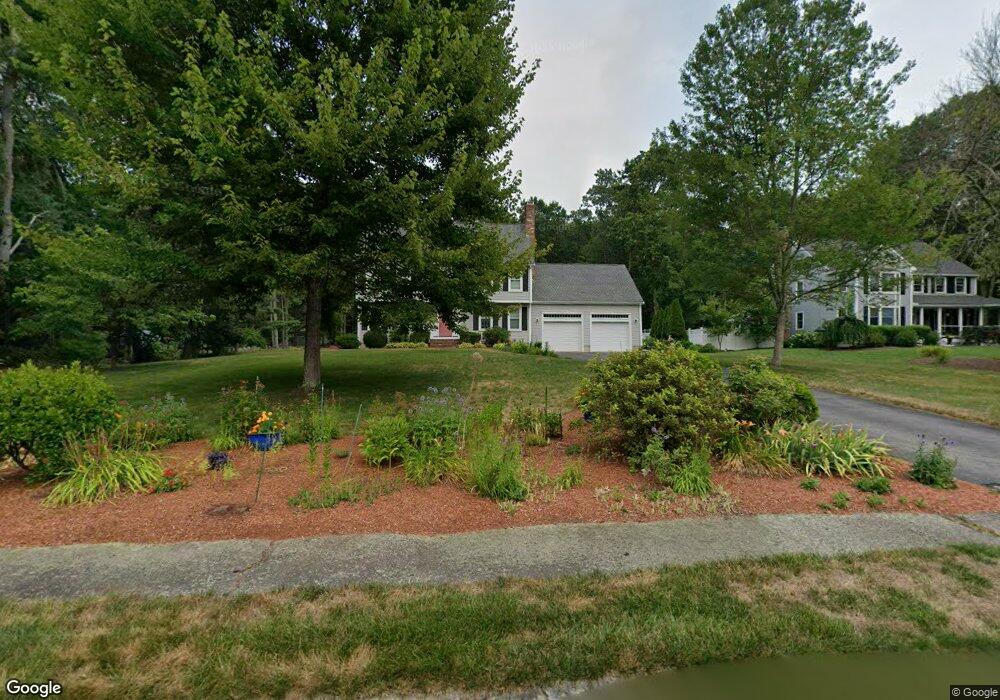
6 Gordon Ct Mansfield, MA 02048
Estimated Value: $895,678 - $1,070,000
3
Beds
3
Baths
2,107
Sq Ft
$449/Sq Ft
Est. Value
About This Home
This home is located at 6 Gordon Ct, Mansfield, MA 02048 and is currently estimated at $946,420, approximately $449 per square foot. 6 Gordon Ct is a home located in Bristol County with nearby schools including Everett W. Robinson Elementary School, Jordan/Jackson Elementary School, and Harold L. Qualters Middle School.
Ownership History
Date
Name
Owned For
Owner Type
Purchase Details
Closed on
Apr 1, 1996
Sold by
Nader Christopher M and Nader Mary A
Bought by
Bailey Thomas R and Bailey Jill M
Current Estimated Value
Home Financials for this Owner
Home Financials are based on the most recent Mortgage that was taken out on this home.
Original Mortgage
$80,000
Outstanding Balance
$3,605
Interest Rate
6.9%
Mortgage Type
Purchase Money Mortgage
Estimated Equity
$942,815
Purchase Details
Closed on
Oct 18, 1989
Sold by
Brookdale Corp
Bought by
Nader Christopher M
Home Financials for this Owner
Home Financials are based on the most recent Mortgage that was taken out on this home.
Original Mortgage
$182,500
Interest Rate
10.06%
Mortgage Type
Purchase Money Mortgage
Create a Home Valuation Report for This Property
The Home Valuation Report is an in-depth analysis detailing your home's value as well as a comparison with similar homes in the area
Home Values in the Area
Average Home Value in this Area
Purchase History
| Date | Buyer | Sale Price | Title Company |
|---|---|---|---|
| Bailey Thomas R | $265,000 | -- | |
| Nader Christopher M | $228,700 | -- |
Source: Public Records
Mortgage History
| Date | Status | Borrower | Loan Amount |
|---|---|---|---|
| Open | Nader Christopher M | $80,000 | |
| Previous Owner | Nader Christopher M | $182,000 | |
| Previous Owner | Nader Christopher M | $184,500 | |
| Previous Owner | Nader Christopher M | $182,500 |
Source: Public Records
Tax History
| Year | Tax Paid | Tax Assessment Tax Assessment Total Assessment is a certain percentage of the fair market value that is determined by local assessors to be the total taxable value of land and additions on the property. | Land | Improvement |
|---|---|---|---|---|
| 2025 | $9,858 | $748,500 | $276,900 | $471,600 |
| 2024 | $9,486 | $702,700 | $289,500 | $413,200 |
| 2023 | $9,163 | $650,300 | $289,500 | $360,800 |
| 2022 | $8,806 | $580,500 | $268,100 | $312,400 |
| 2021 | $9,021 | $587,300 | $252,500 | $334,800 |
| 2020 | $8,884 | $578,400 | $252,500 | $325,900 |
| 2019 | $8,576 | $563,500 | $234,600 | $328,900 |
| 2018 | $2,691 | $546,900 | $223,900 | $323,000 |
| 2017 | $7,986 | $531,700 | $217,600 | $314,100 |
| 2016 | $8,200 | $532,100 | $238,400 | $293,700 |
| 2015 | $8,017 | $517,200 | $238,400 | $278,800 |
Source: Public Records
Map
Nearby Homes
- 128 Tremont St
- 24 Maverick Dr
- 17 Childs Ln
- 1769 West St
- 25 Shepherd St
- 150 Gilbert St
- 14 Claire Ave
- 401 South St
- 40 Treasure Island Rd
- 346 South St
- 9 Coach Rd
- 84 Messenger St
- 16 Treasure Island Rd
- 33 Colonial Way
- 25 Munroe Dr
- 166 Chauncy St
- 2 Oak St Unit 2B
- 46 Mirimichi St
- 38 Mirimichi St
- 356 Central St
Your Personal Tour Guide
Ask me questions while you tour the home.