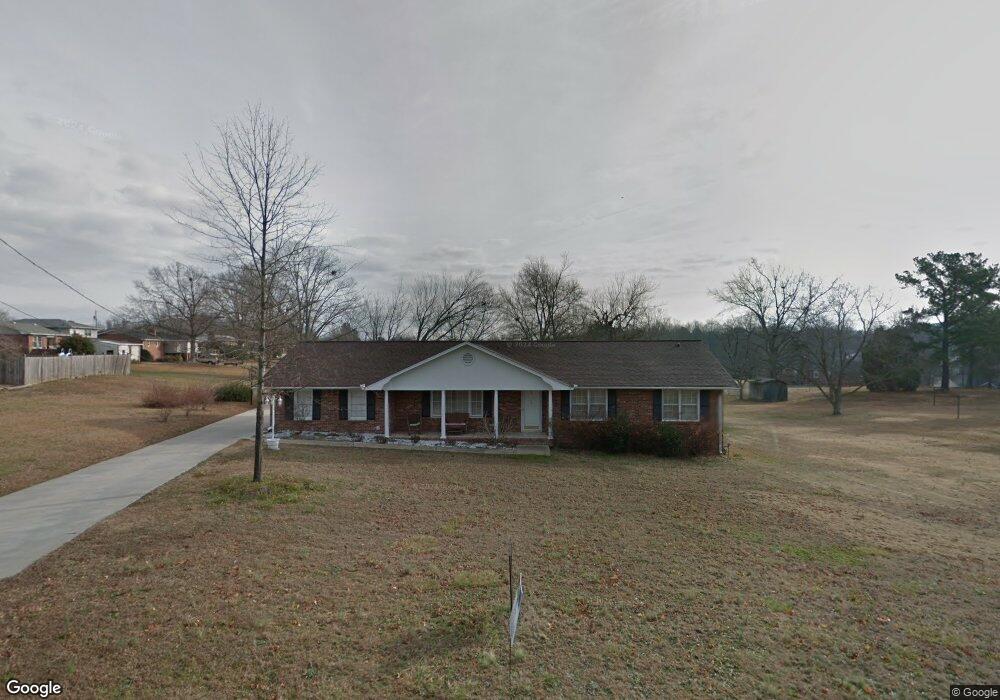
6 Grandview Cir Travelers Rest, SC 29690
Estimated Value: $314,428 - $375,000
3
Beds
2
Baths
1,459
Sq Ft
$239/Sq Ft
Est. Value
About This Home
This home is located at 6 Grandview Cir, Travelers Rest, SC 29690 and is currently estimated at $349,107, approximately $239 per square foot. 6 Grandview Cir is a home located in Greenville County with nearby schools including Gateway Elementary School, Northwest Middle School, and Travelers Rest High School.
Ownership History
Date
Name
Owned For
Owner Type
Purchase Details
Closed on
Jul 24, 2008
Sold by
Mcclellan Donna M
Bought by
Mcclellan Donna M and Skinner Sharon
Current Estimated Value
Home Financials for this Owner
Home Financials are based on the most recent Mortgage that was taken out on this home.
Original Mortgage
$174,620
Outstanding Balance
$111,594
Interest Rate
5.97%
Mortgage Type
FHA
Estimated Equity
$237,513
Purchase Details
Closed on
Jun 23, 2008
Sold by
Mcwhite Mcwhite Connie G Connie G and Mcwhite Scozzari Connie
Bought by
Mcclellan Donna M
Home Financials for this Owner
Home Financials are based on the most recent Mortgage that was taken out on this home.
Original Mortgage
$174,620
Outstanding Balance
$111,594
Interest Rate
5.97%
Mortgage Type
FHA
Estimated Equity
$237,513
Purchase Details
Closed on
May 30, 2006
Sold by
Helfand Lawrence L and Helfand Donna M
Bought by
Mcwhite Connie G
Create a Home Valuation Report for This Property
The Home Valuation Report is an in-depth analysis detailing your home's value as well as a comparison with similar homes in the area
Home Values in the Area
Average Home Value in this Area
Purchase History
| Date | Buyer | Sale Price | Title Company |
|---|---|---|---|
| Mcclellan Donna M | -- | -- | |
| Mcclellan Donna M | $176,000 | -- | |
| Mcwhite Connie G | $145,100 | None Available |
Source: Public Records
Mortgage History
| Date | Status | Borrower | Loan Amount |
|---|---|---|---|
| Open | Mcclellan Donna M | $174,620 |
Source: Public Records
Tax History Compared to Growth
Tax History
| Year | Tax Paid | Tax Assessment Tax Assessment Total Assessment is a certain percentage of the fair market value that is determined by local assessors to be the total taxable value of land and additions on the property. | Land | Improvement |
|---|---|---|---|---|
| 2024 | $1,176 | $6,430 | $1,400 | $5,030 |
| 2023 | $1,176 | $6,430 | $1,400 | $5,030 |
| 2022 | $1,151 | $6,430 | $1,400 | $5,030 |
| 2021 | $1,151 | $6,430 | $1,400 | $5,030 |
| 2020 | $1,075 | $5,700 | $940 | $4,760 |
| 2019 | $1,076 | $5,700 | $940 | $4,760 |
| 2018 | $1,046 | $5,700 | $940 | $4,760 |
| 2017 | $1,046 | $5,700 | $940 | $4,760 |
| 2016 | $1,186 | $142,540 | $23,500 | $119,040 |
| 2015 | $1,186 | $142,540 | $23,500 | $119,040 |
| 2014 | $1,209 | $146,350 | $23,500 | $122,850 |
Source: Public Records
Map
Nearby Homes
- 6206 State Park Rd
- 207 Grandview Cir
- 110 Colony Rd
- 112 Halowell Ln
- 210 Brayton Ct
- 120 Halowell Ln
- 11 Echo Dr
- 201 Tubbs Mountain Rd
- 12 Halowell Ln
- 11 Halowell Ln
- 3 Halowell Ln
- 4 Halowell Ln
- 9 Wild Fern Ct
- 141 Lumpkin St
- 1 Wild Fern Ct
- 129 Shager Place
- 505 Lumpkin St
- 22 Gaskins Trail
- 24 Gaskins Trail
- 4 Gaskins Trail
- 100 Grandview Cir
- 102 Grandview Cir
- 5 Grandview Cir
- 3 Grandview Cir
- 104 Grandview Cir
- 6106 State Park Rd
- 5 View Dr
- 2 Grandview Cir
- 7 Grandview Cir
- 1 Grandview Dr
- 1 Grandview Cir
- 106 Grandview Cir
- 101 Grandview Cir
- 103 Grandview Cir
- 8 Walnut Ln
- 10 Walnut Ln
- 6 Walnut Ln
- 105 Grandview Cir
- 12 Walnut Ln
- 9 Grandview Dr