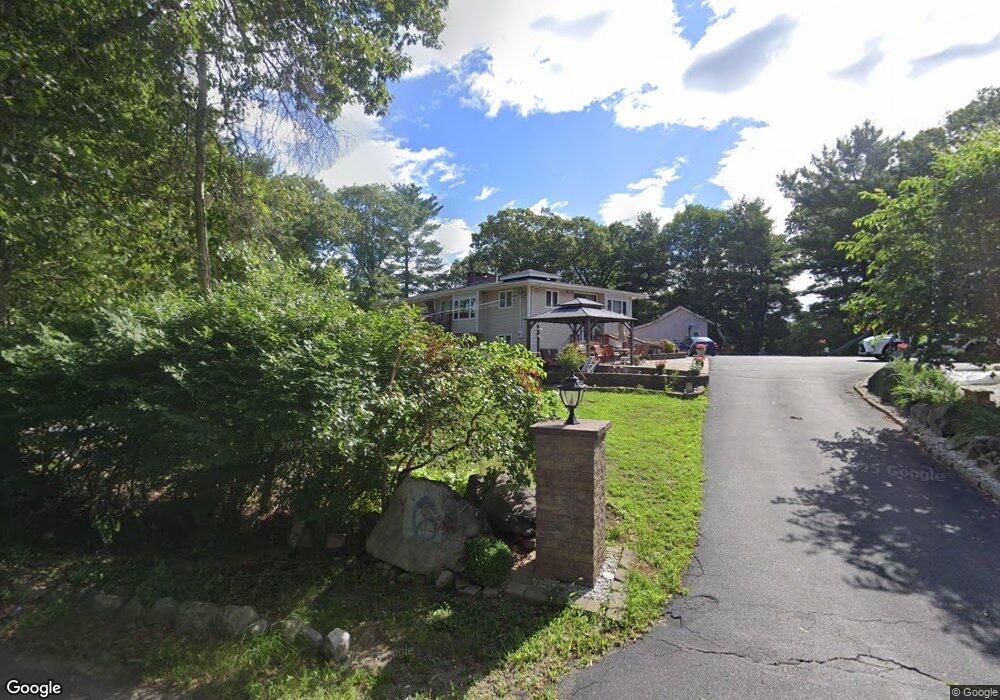
6 Greenmount St Randolph, MA 02368
South Randolph NeighborhoodEstimated Value: $698,000 - $773,000
7
Beds
3
Baths
1,988
Sq Ft
$371/Sq Ft
Est. Value
About This Home
This home is located at 6 Greenmount St, Randolph, MA 02368 and is currently estimated at $737,579, approximately $371 per square foot. 6 Greenmount St is a home located in Norfolk County with nearby schools including Randolph High School and Lighthouse Baptist Christian Academy.
Ownership History
Date
Name
Owned For
Owner Type
Purchase Details
Closed on
Mar 13, 2013
Sold by
6 Greenmount Street Rt and Quach Peggy Y
Bought by
Quach Cindy Y
Current Estimated Value
Home Financials for this Owner
Home Financials are based on the most recent Mortgage that was taken out on this home.
Original Mortgage
$270,000
Outstanding Balance
$190,532
Interest Rate
3.54%
Mortgage Type
New Conventional
Estimated Equity
$547,047
Purchase Details
Closed on
Jan 24, 2008
Sold by
Quach Cindy Y and Quach Peggy Y
Bought by
6 Greenmount Street Rt and Quach Cindy Y
Purchase Details
Closed on
Jul 21, 2004
Sold by
Quach Chau P and Quach Peggy Y
Bought by
Quach Cindy Y and Quach Peggy Y
Purchase Details
Closed on
Oct 30, 1992
Sold by
Good David J and Good Mary E
Bought by
Luu Han B
Home Financials for this Owner
Home Financials are based on the most recent Mortgage that was taken out on this home.
Original Mortgage
$107,000
Interest Rate
7.85%
Mortgage Type
Purchase Money Mortgage
Create a Home Valuation Report for This Property
The Home Valuation Report is an in-depth analysis detailing your home's value as well as a comparison with similar homes in the area
Home Values in the Area
Average Home Value in this Area
Purchase History
| Date | Buyer | Sale Price | Title Company |
|---|---|---|---|
| Quach Cindy Y | -- | -- | |
| 6 Greenmount Street Rt | -- | -- | |
| Quach Cindy Y | -- | -- | |
| Luu Han B | $157,000 | -- |
Source: Public Records
Mortgage History
| Date | Status | Borrower | Loan Amount |
|---|---|---|---|
| Open | Quach Cindy Y | $270,000 | |
| Previous Owner | Luu Han B | $107,000 |
Source: Public Records
Tax History Compared to Growth
Tax History
| Year | Tax Paid | Tax Assessment Tax Assessment Total Assessment is a certain percentage of the fair market value that is determined by local assessors to be the total taxable value of land and additions on the property. | Land | Improvement |
|---|---|---|---|---|
| 2025 | $7,880 | $678,700 | $254,100 | $424,600 |
| 2024 | $7,733 | $675,400 | $249,100 | $426,300 |
| 2023 | $7,335 | $607,200 | $226,600 | $380,600 |
| 2022 | $7,334 | $539,300 | $188,800 | $350,500 |
| 2021 | $7,134 | $482,700 | $157,800 | $324,900 |
| 2020 | $6,918 | $464,000 | $157,800 | $306,200 |
| 2019 | $6,840 | $456,600 | $150,400 | $306,200 |
| 2018 | $6,563 | $413,300 | $139,600 | $273,700 |
| 2017 | $6,330 | $391,200 | $133,100 | $258,100 |
| 2016 | $6,172 | $354,900 | $121,100 | $233,800 |
| 2015 | $6,036 | $333,500 | $115,300 | $218,200 |
Source: Public Records
Map
Nearby Homes