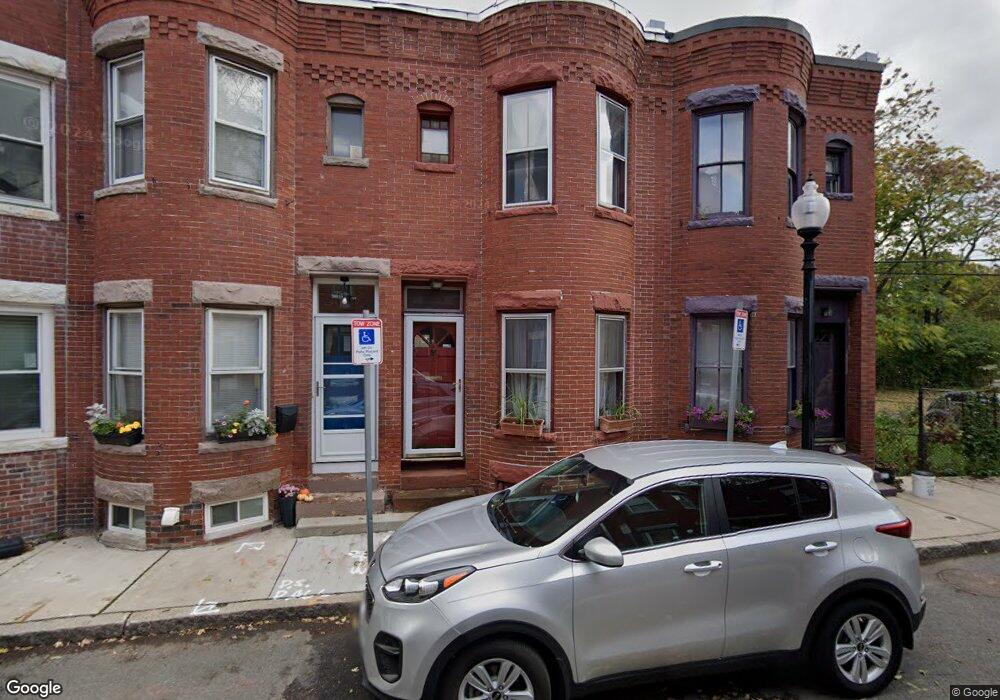
6 Greenwich Ct Roxbury Crossing, MA 02120
Lower Roxbury NeighborhoodEstimated Value: $672,816 - $936,000
3
Beds
2
Baths
1,209
Sq Ft
$665/Sq Ft
Est. Value
About This Home
This home is located at 6 Greenwich Ct, Roxbury Crossing, MA 02120 and is currently estimated at $804,204, approximately $665 per square foot. 6 Greenwich Ct is a home located in Suffolk County with nearby schools including Edward M. Kennedy Academy for Health Careers.
Ownership History
Date
Name
Owned For
Owner Type
Purchase Details
Closed on
Apr 19, 2006
Sold by
Graham Marlon M
Bought by
Kimmel Jill and Robidoux Kyle
Current Estimated Value
Home Financials for this Owner
Home Financials are based on the most recent Mortgage that was taken out on this home.
Original Mortgage
$324,700
Outstanding Balance
$186,702
Interest Rate
6.37%
Mortgage Type
Purchase Money Mortgage
Estimated Equity
$617,502
Create a Home Valuation Report for This Property
The Home Valuation Report is an in-depth analysis detailing your home's value as well as a comparison with similar homes in the area
Home Values in the Area
Average Home Value in this Area
Purchase History
| Date | Buyer | Sale Price | Title Company |
|---|---|---|---|
| Kimmel Jill | $252,000 | -- |
Source: Public Records
Mortgage History
| Date | Status | Borrower | Loan Amount |
|---|---|---|---|
| Open | Kimmel Jill | $324,700 |
Source: Public Records
Tax History Compared to Growth
Tax History
| Year | Tax Paid | Tax Assessment Tax Assessment Total Assessment is a certain percentage of the fair market value that is determined by local assessors to be the total taxable value of land and additions on the property. | Land | Improvement |
|---|---|---|---|---|
| 2025 | $6,258 | $540,400 | $168,900 | $371,500 |
| 2024 | $5,513 | $505,800 | $169,700 | $336,100 |
| 2023 | $5,528 | $514,700 | $169,700 | $345,000 |
| 2022 | $5,183 | $476,400 | $157,100 | $319,300 |
| 2021 | $4,984 | $467,100 | $154,000 | $313,100 |
| 2020 | $4,273 | $404,600 | $150,300 | $254,300 |
| 2019 | $3,975 | $377,100 | $119,500 | $257,600 |
| 2018 | $3,694 | $352,500 | $119,500 | $233,000 |
| 2017 | $3,264 | $308,200 | $93,500 | $214,700 |
| 2016 | $3,229 | $293,500 | $93,500 | $200,000 |
| 2015 | $3,255 | $268,800 | $94,100 | $174,700 |
| 2014 | $3,189 | $253,500 | $94,100 | $159,400 |
Source: Public Records
Map
Nearby Homes
- 41 Greenwich St
- 1011 Tremont St
- 32 Williams St Unit 1
- 1950 Washington St Unit 5C
- 2149 Washington St Unit 604
- 2149 Washington St Unit 610
- 2149 Washington St Unit 601
- 239 Northampton St
- 263-265 Northampton St Unit 206
- 491 Massachusetts Ave Unit 1
- 583 Massachusetts Ave Unit 5
- 483 Massachusetts Ave Unit 7
- 592 Columbus Ave Unit 1
- 492 Massachusetts Ave Unit 53
- 530 Massachusetts Ave Unit 2
- 451-453 Massachusetts Ave Unit 8
- 10 Taber St Unit 603
- 10 Taber St Unit 501
- 771 Tremont St Unit 2
- 460 Massachusetts Ave Unit B
- 6 Greenwich Ct Unit 3
- 6 Greenwich Ct Unit 2
- 4 Greenwich Ct
- 2 Greenwich Ct
- 2 Greenwich Ct Unit 1
- 19 Greenwich St
- 15 Greenwich St
- 17 Greenwich St
- 13 Greenwich St
- 13 Greenwich St
- 13 Greenwich St Unit 13
- 21 Greenwich St
- 1 Greenwich Ct Unit 1
- 7 Greenwich Ct
- 7 Greenwich Ct Unit 1
- 39& 41 Greenwich St
- 3 Greenwich Ct
- 3 Greenwich Ct Unit 1
- 5 Greenwich Ct
- 39 Greenwich St