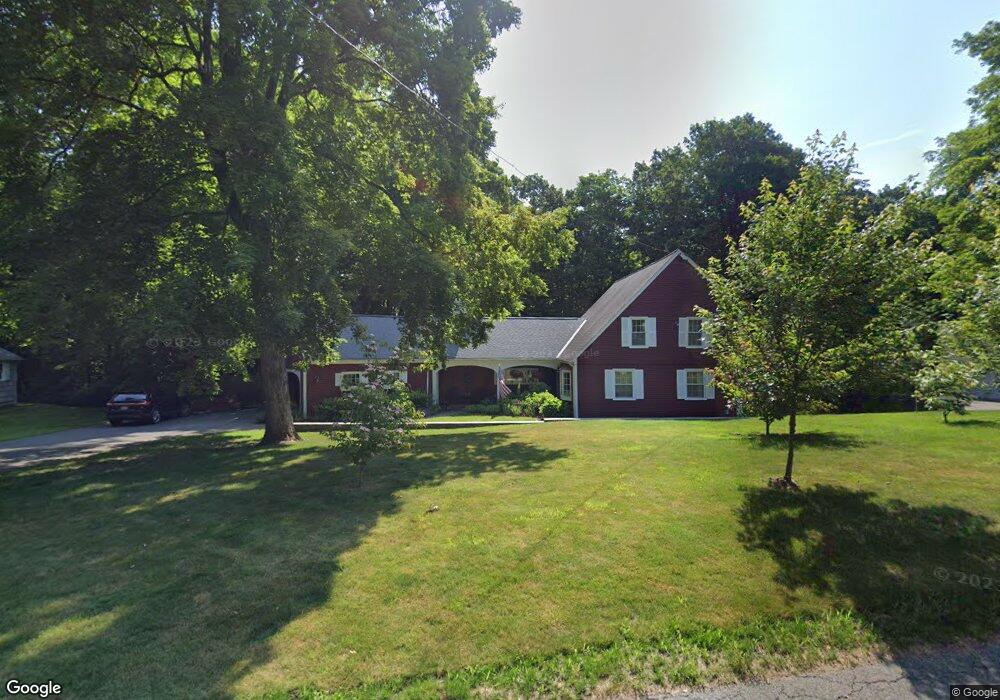
6 Greenwood Rd Wilbraham, MA 01095
Estimated Value: $511,724 - $595,000
4
Beds
2
Baths
2,184
Sq Ft
$259/Sq Ft
Est. Value
About This Home
This home is located at 6 Greenwood Rd, Wilbraham, MA 01095 and is currently estimated at $565,181, approximately $258 per square foot. 6 Greenwood Rd is a home located in Hampden County with nearby schools including Minnechaug Regional High School, Springfield International Charter School, and Wilbraham & Monson Academy.
Ownership History
Date
Name
Owned For
Owner Type
Purchase Details
Closed on
Mar 3, 2003
Sold by
Kenny David D and Kenny Jane D
Bought by
Killian Paula C and Killian Stephen L
Current Estimated Value
Home Financials for this Owner
Home Financials are based on the most recent Mortgage that was taken out on this home.
Original Mortgage
$237,900
Outstanding Balance
$103,019
Interest Rate
5.98%
Mortgage Type
Purchase Money Mortgage
Estimated Equity
$462,162
Create a Home Valuation Report for This Property
The Home Valuation Report is an in-depth analysis detailing your home's value as well as a comparison with similar homes in the area
Home Values in the Area
Average Home Value in this Area
Purchase History
| Date | Buyer | Sale Price | Title Company |
|---|---|---|---|
| Killian Paula C | $290,000 | -- |
Source: Public Records
Mortgage History
| Date | Status | Borrower | Loan Amount |
|---|---|---|---|
| Open | Killian Paula C | $237,900 |
Source: Public Records
Tax History Compared to Growth
Tax History
| Year | Tax Paid | Tax Assessment Tax Assessment Total Assessment is a certain percentage of the fair market value that is determined by local assessors to be the total taxable value of land and additions on the property. | Land | Improvement |
|---|---|---|---|---|
| 2025 | $8,361 | $467,600 | $103,900 | $363,700 |
| 2024 | $8,429 | $455,600 | $103,900 | $351,700 |
| 2023 | $7,727 | $413,500 | $103,900 | $309,600 |
| 2022 | $7,727 | $377,100 | $103,900 | $273,200 |
| 2021 | $7,207 | $313,900 | $110,900 | $203,000 |
| 2020 | $7,025 | $313,900 | $110,900 | $203,000 |
| 2019 | $6,843 | $313,900 | $110,900 | $203,000 |
| 2018 | $6,837 | $302,000 | $110,900 | $191,100 |
| 2017 | $6,644 | $302,000 | $110,900 | $191,100 |
| 2016 | $6,316 | $292,400 | $122,800 | $169,600 |
| 2015 | $6,105 | $292,400 | $122,800 | $169,600 |
Source: Public Records
Map
Nearby Homes
- 20 Old Orchard Rd
- 2 Bayberry Dr Unit 51
- 474 Mountain Rd
- 6 Hilltop Park
- 8 Patriot Ridge Ln
- 28 Decorie Dr
- 474-480 Mountain Rd
- 68 Monson Rd
- 79 High Pine Cir
- 69 High Pine Cir
- 54 High Pine Cir
- 2 Vista Rd
- 35 Lake Dr
- 603 Glendale Rd
- 4 Hillcrest Dr
- 46 Washington Rd
- 182 Mountain Rd
- 17 Peak Rd
- 6 Teak Terrace Unit 24
- 99 Sandalwood Dr Unit site 00