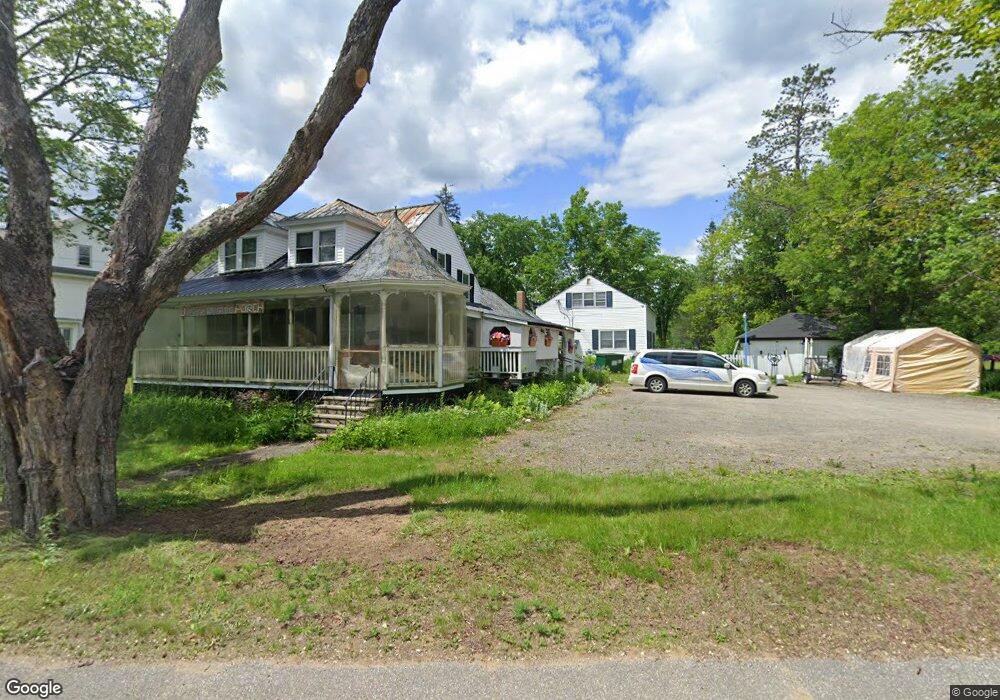
6 Hall Hill Rd Dixfield, ME 04224
Estimated Value: $153,000 - $212,924
5
Beds
3
Baths
700
Sq Ft
$276/Sq Ft
Est. Value
About This Home
This home is located at 6 Hall Hill Rd, Dixfield, ME 04224 and is currently estimated at $193,231, approximately $276 per square foot. 6 Hall Hill Rd is a home located in Oxford County with nearby schools including Hezion Academy and Webb River seventh-day Adventist School.
Ownership History
Date
Name
Owned For
Owner Type
Purchase Details
Closed on
Mar 27, 2007
Sold by
Bailey Clinton W
Bought by
Bailey Clinton W and Angel Wanda
Current Estimated Value
Home Financials for this Owner
Home Financials are based on the most recent Mortgage that was taken out on this home.
Original Mortgage
$17,950
Outstanding Balance
$10,847
Interest Rate
6.23%
Mortgage Type
FHA
Estimated Equity
$182,384
Create a Home Valuation Report for This Property
The Home Valuation Report is an in-depth analysis detailing your home's value as well as a comparison with similar homes in the area
Home Values in the Area
Average Home Value in this Area
Purchase History
| Date | Buyer | Sale Price | Title Company |
|---|---|---|---|
| Bailey Clinton W | $1,001 | -- |
Source: Public Records
Mortgage History
| Date | Status | Borrower | Loan Amount |
|---|---|---|---|
| Open | Bailey Clinton W | $9,250 | |
| Open | Bailey Clinton W | $17,950 | |
| Open | Bailey Clinton W | $144,000 |
Source: Public Records
Tax History Compared to Growth
Tax History
| Year | Tax Paid | Tax Assessment Tax Assessment Total Assessment is a certain percentage of the fair market value that is determined by local assessors to be the total taxable value of land and additions on the property. | Land | Improvement |
|---|---|---|---|---|
| 2024 | $1,920 | $85,900 | $23,400 | $62,500 |
| 2023 | $1,847 | $85,900 | $23,400 | $62,500 |
| 2022 | $1,847 | $85,900 | $23,400 | $62,500 |
| 2021 | $2,062 | $85,900 | $23,400 | $62,500 |
| 2020 | $1,906 | $85,900 | $23,400 | $62,500 |
| 2019 | $4,298 | $85,900 | $23,400 | $62,500 |
| 2018 | $2,285 | $85,900 | $23,400 | $62,500 |
| 2017 | $2,788 | $125,000 | $28,600 | $96,400 |
| 2016 | $2,513 | $125,000 | $28,600 | $96,400 |
| 2015 | $2,550 | $125,000 | $28,600 | $96,400 |
| 2014 | $2,411 | $124,940 | $28,560 | $96,380 |
| 2013 | $2,430 | $124,940 | $28,560 | $96,380 |
Source: Public Records
Map
Nearby Homes