6 Harboard Rd Johnston, RI 02919
Killingly Street NeighborhoodEstimated Value: $331,000 - $374,000
About This Home
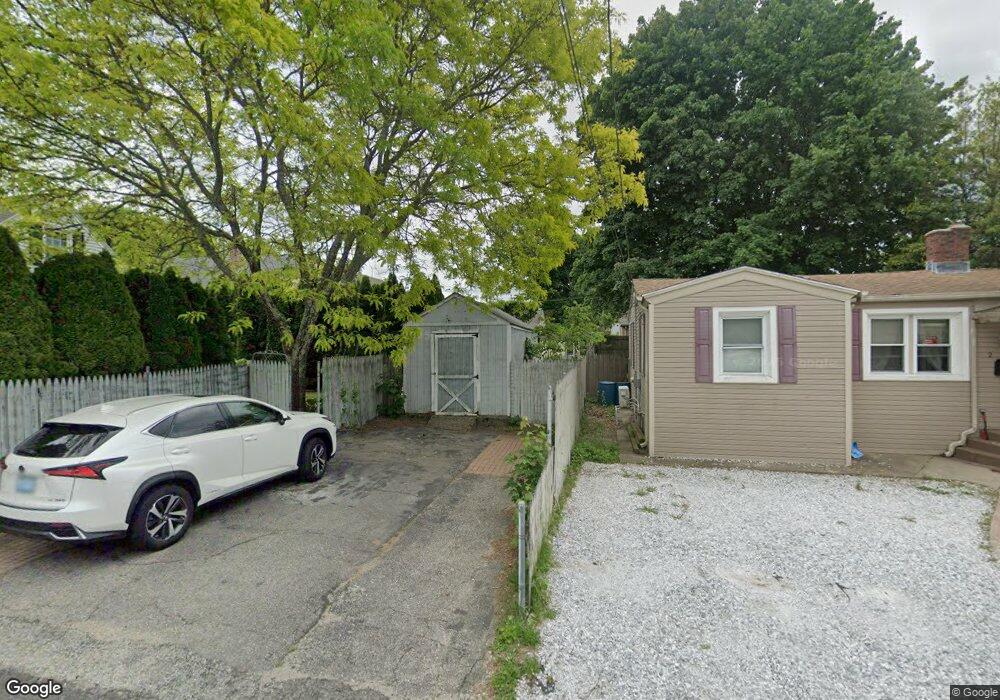
This home is located at 6 Harboard Rd, Johnston, RI 02919 and is currently estimated at $344,806, approximately $310 per square foot. 6 Harboard Rd is a home located in Providence County with nearby schools including Johnston Senior High School, Achievement First Promesa, and Achievement First Providence Mayoral Academy Elementary School.
Ownership History
Purchase Details
Home Financials for this Owner
Home Financials are based on the most recent Mortgage that was taken out on this home.Purchase Details
Purchase Details
Purchase Details
Home Values in the Area
Average Home Value in this Area
Purchase History
We collect this data history from publicly available records. To have your information removed, we recommend requesting removal directly through your county’s website.
| Date | Buyer | Sale Price | Title Company |
|---|---|---|---|
| Willcutt Jessica | $335,000 | -- | |
| Cairns James R | $121,000 | -- | |
| Sajowski Thomas D | $78,500 | -- | |
| Laurenza Domenic E | $85,000 | -- | |
| Cairns James R | $121,000 | -- | |
| Sajowski Thomas D | $78,500 | -- | |
| Laurenza Domenic E | $85,000 | -- |
Mortgage History
We collect this data history from publicly available records. To have your information removed, we recommend requesting removal directly through your county’s website.
| Date | Status | Borrower | Loan Amount |
|---|---|---|---|
| Open | Willcutt Jessica | $328,932 | |
| Previous Owner | Laurenza Domenic E | $25,000 | |
| Previous Owner | Laurenza Domenic E | $128,100 |
Tax History
| Year | Tax Paid | Tax Assessment Tax Assessment Total Assessment is a certain percentage of the fair market value that is determined by local assessors to be the total taxable value of land and additions on the property. | Land | Improvement |
|---|---|---|---|---|
| 2025 | $3,833 | $245,400 | $83,300 | $162,100 |
| 2024 | $3,755 | $245,400 | $83,300 | $162,100 |
| 2023 | $3,755 | $245,400 | $83,300 | $162,100 |
| 2022 | $3,828 | $164,700 | $64,000 | $100,700 |
| 2021 | $3,828 | $164,700 | $64,000 | $100,700 |
| 2018 | $3,568 | $129,800 | $50,300 | $79,500 |
| 2016 | $4,721 | $129,800 | $50,300 | $79,500 |
| 2015 | $3,595 | $124,000 | $52,600 | $71,400 |
| 2014 | $3,565 | $124,000 | $52,600 | $71,400 |
| 2013 | $3,565 | $124,000 | $52,600 | $71,400 |
Map
- 0 Orchard St Unit 1396400
- 8 Ashby St
- 39 Horace St
- 0 Central Ave Unit 1406483
- 14 S Fairview St
- 19 S Long St
- 85 Sunset Ave
- 35 Myra St
- 35 N Long St
- 25 Lecia Dr
- 37 N Fairview St
- 60 Ophelia St
- 66 Ophelia St
- 32 Harrington Dr
- 514 Killingly St
- 10 Corrine Dr
- 29 Calumet Ave
- 89 Dedham Ave
- 110 Petteys Ave
- 9 Heath St
Ask me questions while you tour the home.