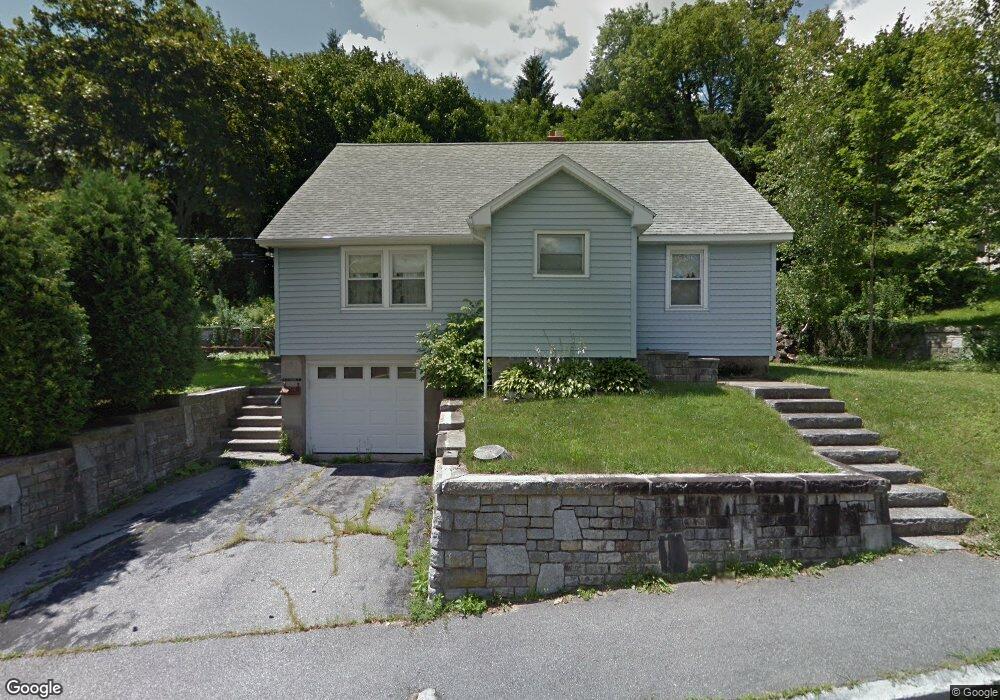
6 Harwich St Worcester, MA 01607
South Quinsigamond Village NeighborhoodEstimated Value: $461,897 - $535,000
4
Beds
2
Baths
1,890
Sq Ft
$258/Sq Ft
Est. Value
About This Home
This home is located at 6 Harwich St, Worcester, MA 01607 and is currently estimated at $487,224, approximately $257 per square foot. 6 Harwich St is a home located in Worcester County with nearby schools including Quinsigamond School, Jacob Hiatt Magnet School, and Chandler Magnet.
Ownership History
Date
Name
Owned For
Owner Type
Purchase Details
Closed on
Jun 21, 2016
Sold by
Lucas Donald W and Rasku Mary J
Bought by
Donaldson Julie
Current Estimated Value
Home Financials for this Owner
Home Financials are based on the most recent Mortgage that was taken out on this home.
Original Mortgage
$180,000
Outstanding Balance
$143,446
Interest Rate
3.61%
Mortgage Type
New Conventional
Estimated Equity
$343,778
Purchase Details
Closed on
Feb 16, 2010
Sold by
Lucas Jane F
Bought by
Jane F Lucas Ret and Lucas Jane F
Create a Home Valuation Report for This Property
The Home Valuation Report is an in-depth analysis detailing your home's value as well as a comparison with similar homes in the area
Home Values in the Area
Average Home Value in this Area
Purchase History
| Date | Buyer | Sale Price | Title Company |
|---|---|---|---|
| Donaldson Julie | $225,000 | -- | |
| Rasku Mary J | -- | -- | |
| Jane F Lucas Ret | -- | -- |
Source: Public Records
Mortgage History
| Date | Status | Borrower | Loan Amount |
|---|---|---|---|
| Open | Donaldson Julie | $180,000 |
Source: Public Records
Tax History
| Year | Tax Paid | Tax Assessment Tax Assessment Total Assessment is a certain percentage of the fair market value that is determined by local assessors to be the total taxable value of land and additions on the property. | Land | Improvement |
|---|---|---|---|---|
| 2025 | $5,753 | $436,200 | $119,500 | $316,700 |
| 2024 | $5,620 | $408,700 | $119,500 | $289,200 |
| 2023 | $5,406 | $377,000 | $103,900 | $273,100 |
| 2022 | $5,073 | $333,500 | $83,100 | $250,400 |
| 2021 | $5,019 | $308,300 | $66,500 | $241,800 |
| 2020 | $3,649 | $286,300 | $66,400 | $219,900 |
| 2019 | $4,635 | $257,500 | $60,100 | $197,400 |
| 2018 | $17,217 | $245,500 | $60,100 | $185,400 |
| 2017 | $4,424 | $230,200 | $60,100 | $170,100 |
| 2016 | $4,448 | $215,800 | $45,600 | $170,200 |
| 2015 | $4,331 | $215,800 | $45,600 | $170,200 |
| 2014 | $4,217 | $215,800 | $45,600 | $170,200 |
Source: Public Records
Map
Nearby Homes
- 29 Steele St
- 49 Strasburg Rd
- 4 Stockholm St
- 30 Ekman St
- 6 Beckman St
- 50 Whipple St
- 22 Bittersweet Blvd
- 50 Sophia Dr
- 73 Sophia Dr
- 6 Epworth St
- 47 Gibbs St
- 557 SW Cutoff Unit 17
- 154 Pakachoag St
- 464-466 Granite St
- 460-462 Granite St
- 460-466 Granite St
- 557 SW Cutoff Unit 55
- 557 SW Cutoff Unit 60
- 457 Granite St
- 3 Payson St
Your Personal Tour Guide
Ask me questions while you tour the home.