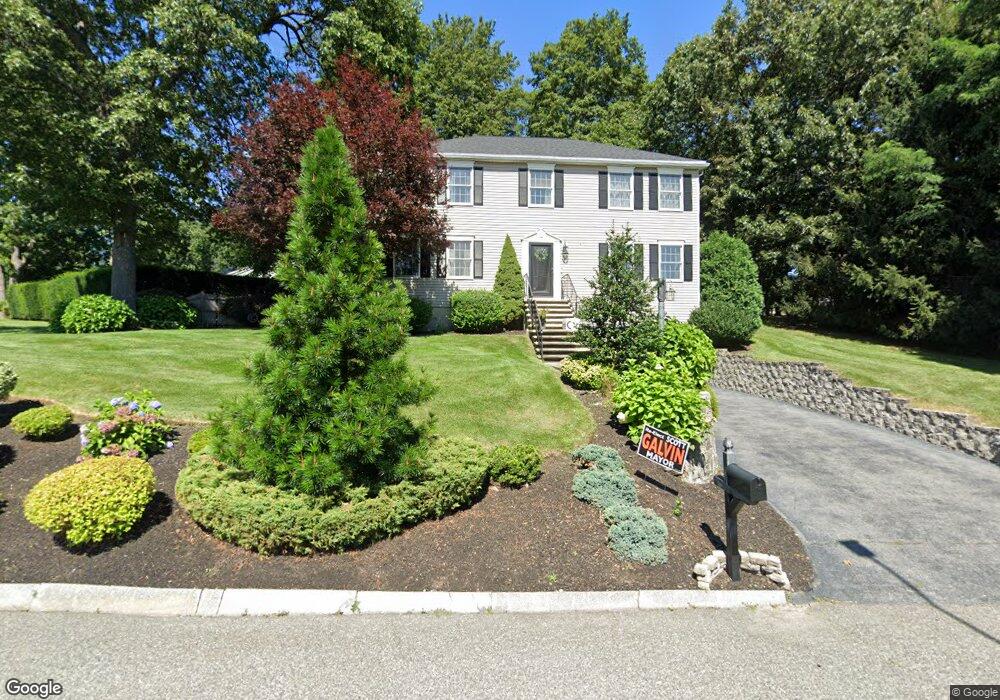
6 Hawley St Woburn, MA 01801
Downtown Woburn NeighborhoodEstimated Value: $929,000 - $1,029,000
4
Beds
3
Baths
2,100
Sq Ft
$457/Sq Ft
Est. Value
About This Home
This home is located at 6 Hawley St, Woburn, MA 01801 and is currently estimated at $959,168, approximately $456 per square foot. 6 Hawley St is a home located in Middlesex County with nearby schools including Shamrock Elementary School, Daniel L. Joyce Middle School, and Woburn High School.
Ownership History
Date
Name
Owned For
Owner Type
Purchase Details
Closed on
Nov 14, 2024
Sold by
Deane Mark A and Deane Dale F
Bought by
Mark A Deane T A and Mark Deane
Current Estimated Value
Purchase Details
Closed on
Mar 12, 1998
Sold by
Melanson Dev Grp Inc
Bought by
Colonial Bldrs Inc
Home Financials for this Owner
Home Financials are based on the most recent Mortgage that was taken out on this home.
Original Mortgage
$200,000
Interest Rate
7.03%
Mortgage Type
Purchase Money Mortgage
Create a Home Valuation Report for This Property
The Home Valuation Report is an in-depth analysis detailing your home's value as well as a comparison with similar homes in the area
Home Values in the Area
Average Home Value in this Area
Purchase History
| Date | Buyer | Sale Price | Title Company |
|---|---|---|---|
| Mark A Deane T A | -- | None Available | |
| Mark A Deane T A | -- | None Available | |
| Colonial Bldrs Inc | $125,000 | -- |
Source: Public Records
Mortgage History
| Date | Status | Borrower | Loan Amount |
|---|---|---|---|
| Previous Owner | Colonial Bldrs Inc | $150,000 | |
| Previous Owner | Colonial Bldrs Inc | $200,000 |
Source: Public Records
Tax History
| Year | Tax Paid | Tax Assessment Tax Assessment Total Assessment is a certain percentage of the fair market value that is determined by local assessors to be the total taxable value of land and additions on the property. | Land | Improvement |
|---|---|---|---|---|
| 2025 | $7,852 | $919,400 | $335,200 | $584,200 |
| 2024 | $7,058 | $875,700 | $319,200 | $556,500 |
| 2023 | $6,881 | $790,900 | $290,300 | $500,600 |
| 2022 | $6,751 | $722,800 | $252,500 | $470,300 |
| 2021 | $0 | $695,700 | $240,500 | $455,200 |
| 2020 | $6,226 | $668,000 | $240,500 | $427,500 |
| 2019 | $6,007 | $632,300 | $229,100 | $403,200 |
| 2018 | $0 | $582,400 | $210,200 | $372,200 |
| 2017 | $79,218 | $536,700 | $200,300 | $336,400 |
| 2016 | $5,107 | $508,200 | $187,200 | $321,000 |
| 2015 | $5,008 | $492,400 | $175,000 | $317,400 |
| 2014 | $4,840 | $463,600 | $175,000 | $288,600 |
Source: Public Records
Map
Nearby Homes
- 31 Tremont St
- 21 Eastern Ave
- 39 Jefferson Ave
- 0 Mount Pleasant St
- 6 Highland St
- 35 Montvale Ave Unit 8
- 31 Montvale Ave Unit 2
- 7 Prospect St
- 18 Central St
- 16 Felton St
- 477 Main St
- 9 Charles Rd
- 14 Church Ave
- 6 Porter St
- 555 Main St Unit 11
- 52 Pleasant St
- 18 Cranston Cir
- 15 Sturgis St
- 7 Conant Rd Unit 33
- 19 Mason Way Unit 75
Your Personal Tour Guide
Ask me questions while you tour the home.