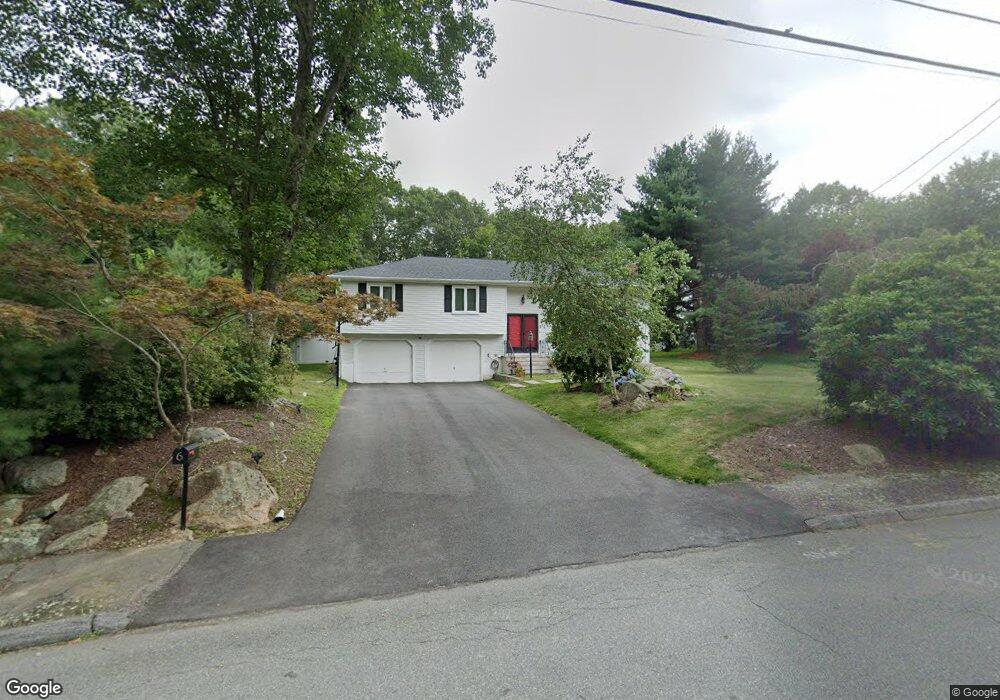
6 Hickory Way Sharon, MA 02067
Estimated Value: $793,000 - $872,000
3
Beds
2
Baths
1,650
Sq Ft
$505/Sq Ft
Est. Value
About This Home
This home is located at 6 Hickory Way, Sharon, MA 02067 and is currently estimated at $833,484, approximately $505 per square foot. 6 Hickory Way is a home located in Norfolk County with nearby schools including East Elementary School, Sharon Middle School, and Sharon High School.
Ownership History
Date
Name
Owned For
Owner Type
Purchase Details
Closed on
Nov 9, 2012
Sold by
Dang Leanna Q and Dang Thomas
Bought by
Tllm T
Current Estimated Value
Purchase Details
Closed on
Oct 2, 2007
Sold by
Reid Phyllis A and Waterman Phyllis A
Bought by
Dang Leanna Q and Dang Thomas
Home Financials for this Owner
Home Financials are based on the most recent Mortgage that was taken out on this home.
Original Mortgage
$100,000
Interest Rate
6.65%
Mortgage Type
Purchase Money Mortgage
Purchase Details
Closed on
Jun 27, 1991
Sold by
Levy Tr Karen R
Bought by
Reid Phyllis A
Home Financials for this Owner
Home Financials are based on the most recent Mortgage that was taken out on this home.
Original Mortgage
$50,000
Interest Rate
9.44%
Mortgage Type
Purchase Money Mortgage
Create a Home Valuation Report for This Property
The Home Valuation Report is an in-depth analysis detailing your home's value as well as a comparison with similar homes in the area
Home Values in the Area
Average Home Value in this Area
Purchase History
| Date | Buyer | Sale Price | Title Company |
|---|---|---|---|
| Tllm T | -- | -- | |
| Dang Leanna Q | $436,000 | -- | |
| Reid Phyllis A | $207,500 | -- |
Source: Public Records
Mortgage History
| Date | Status | Borrower | Loan Amount |
|---|---|---|---|
| Previous Owner | Dang Leanna Q | $100,000 | |
| Previous Owner | Reid Phyllis A | $50,000 | |
| Previous Owner | Reid Phyllis A | $85,675 |
Source: Public Records
Tax History Compared to Growth
Tax History
| Year | Tax Paid | Tax Assessment Tax Assessment Total Assessment is a certain percentage of the fair market value that is determined by local assessors to be the total taxable value of land and additions on the property. | Land | Improvement |
|---|---|---|---|---|
| 2025 | $12,853 | $735,300 | $444,000 | $291,300 |
| 2024 | $12,417 | $706,300 | $407,400 | $298,900 |
| 2023 | $12,117 | $651,800 | $380,800 | $271,000 |
| 2022 | $11,467 | $580,600 | $317,300 | $263,300 |
| 2021 | $11,394 | $557,700 | $299,400 | $258,300 |
| 2020 | $10,596 | $557,700 | $299,400 | $258,300 |
| 2019 | $10,425 | $537,100 | $278,800 | $258,300 |
| 2018 | $10,297 | $531,600 | $273,300 | $258,300 |
| 2017 | $10,079 | $513,700 | $255,400 | $258,300 |
| 2016 | $9,870 | $490,800 | $255,400 | $235,400 |
| 2015 | $9,322 | $459,200 | $238,100 | $221,100 |
| 2014 | $8,627 | $419,800 | $216,500 | $203,300 |
Source: Public Records
Map
Nearby Homes
- 30 Hampton Rd
- 40 Lyndon Rd
- 6 Tall Tree Rd
- 157 Wilshire Dr
- 74 Eisenhower Dr
- 172 Wilshire Dr
- 16 Deerfield Rd
- 15 Paul Revere Rd
- 2 Palace Ct
- 71 Morse St
- 49 Cottage St
- 15 Sparrow Rd
- 376 Mountain St
- 20 Sparrow Rd
- 150 Pond St
- 350 Mountain St
- 14 Cottage St
- 137 Pond St
- 285 Massapoag Ave
- 5 Trowel Pond Shop Rd Unit C