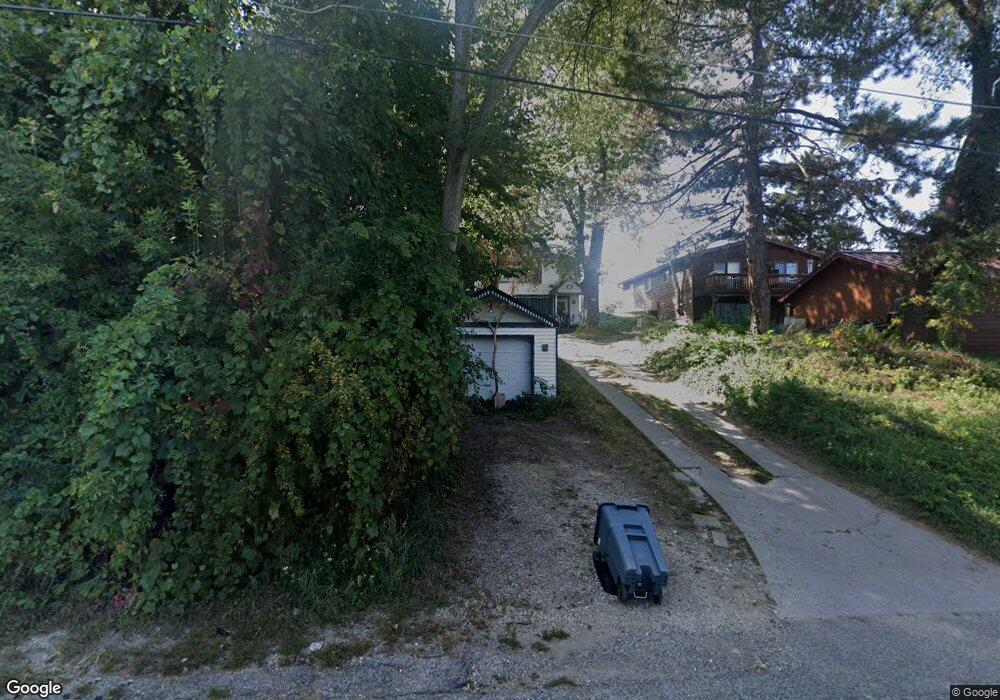
6 Hillcrest Ave Fox Lake, IL 60020
Estimated Value: $270,348 - $285,000
4
Beds
2
Baths
1,842
Sq Ft
$152/Sq Ft
Est. Value
About This Home
This home is located at 6 Hillcrest Ave, Fox Lake, IL 60020 and is currently estimated at $280,587, approximately $152 per square foot. 6 Hillcrest Ave is a home located in Lake County with nearby schools including Lotus Elementary School, Stanton Middle School, and Grant Community High School.
Ownership History
Date
Name
Owned For
Owner Type
Purchase Details
Closed on
Jun 28, 2004
Sold by
Smith Leslie B
Bought by
Hagans Bancroft Carolynn
Current Estimated Value
Home Financials for this Owner
Home Financials are based on the most recent Mortgage that was taken out on this home.
Original Mortgage
$137,600
Interest Rate
6.35%
Mortgage Type
Purchase Money Mortgage
Purchase Details
Closed on
Jun 21, 2002
Sold by
Knebel Randall J and Knebel Sandra L
Bought by
Smith Leslie B
Home Financials for this Owner
Home Financials are based on the most recent Mortgage that was taken out on this home.
Original Mortgage
$100,000
Interest Rate
6.79%
Purchase Details
Closed on
Dec 18, 1998
Sold by
Novak Susan M and Susan M Novak Living Trust
Bought by
Knebel Randall J and Knebel Sandra L
Home Financials for this Owner
Home Financials are based on the most recent Mortgage that was taken out on this home.
Original Mortgage
$107,500
Interest Rate
6.79%
Create a Home Valuation Report for This Property
The Home Valuation Report is an in-depth analysis detailing your home's value as well as a comparison with similar homes in the area
Home Values in the Area
Average Home Value in this Area
Purchase History
| Date | Buyer | Sale Price | Title Company |
|---|---|---|---|
| Hagans Bancroft Carolynn | $172,000 | Ticor Title Insurance Compan | |
| Smith Leslie B | $161,500 | Premier Title | |
| Knebel Randall J | $135,000 | 1St American Title |
Source: Public Records
Mortgage History
| Date | Status | Borrower | Loan Amount |
|---|---|---|---|
| Previous Owner | Hagans Bancroft Carolynn | $137,600 | |
| Previous Owner | Smith Leslie B | $100,000 | |
| Previous Owner | Knebel Randall J | $107,500 | |
| Closed | Hagans Bancroft Carolynn | $25,800 |
Source: Public Records
Tax History Compared to Growth
Tax History
| Year | Tax Paid | Tax Assessment Tax Assessment Total Assessment is a certain percentage of the fair market value that is determined by local assessors to be the total taxable value of land and additions on the property. | Land | Improvement |
|---|---|---|---|---|
| 2024 | $5,292 | $79,365 | $8,872 | $70,493 |
| 2023 | $5,587 | $68,305 | $8,358 | $59,947 |
| 2022 | $5,587 | $67,410 | $6,187 | $61,223 |
| 2021 | $5,390 | $63,541 | $5,832 | $57,709 |
| 2020 | $4,908 | $57,530 | $5,749 | $51,781 |
| 2019 | $4,673 | $55,169 | $5,513 | $49,656 |
| 2018 | $4,653 | $54,796 | $6,918 | $47,878 |
| 2017 | $4,526 | $50,648 | $6,394 | $44,254 |
| 2016 | $4,512 | $46,322 | $5,848 | $40,474 |
| 2015 | $4,257 | $43,227 | $5,457 | $37,770 |
| 2014 | $4,136 | $36,594 | $8,763 | $27,831 |
| 2012 | $4,315 | $44,781 | $9,132 | $35,649 |
Source: Public Records
Map
Nearby Homes
- 127 E Grand Ave
- 10 S Maple Ave
- 37 Hillcrest Ave
- 9 Lakeside Ln
- 38 S Maple Ave
- 8 S Lake Ave
- 29 S Hickory Ave
- 21 Hillside Dr
- 35 Medinah Ave
- 50 N Lake Ave
- 43 Lippincott Rd
- 85 Woodhills Bay Rd Unit 85
- 71 White Oaks Rd Unit 71
- 411 Kings Rd
- 541 Foxridge Dr Unit 13D
- 17 Arlington Rd
- 35675 N Marine Dr
- 36 S Pistakee Lake Rd
- 616 Windsor Dr Unit D
- 89 Maude Ave Unit A
- 4 Hillcrest Ave
- 8 Hillcrest Ave
- 10 Hillcrest Ave
- 12 Hillcrest Ave
- 5 Woodland Ave
- 5 Woodland Ave Unit LOT 5
- 3 Woodland Ave
- 7 Woodland Ave
- 7 Hillcrest Ave
- 9 Woodland Ave
- 1 Woodland Ave
- 14 Hillcrest Ave
- 9 Hillcrest Ave
- 11 Woodland Ave
- 136 Cypress Ave
- 147 E Grand Ave
- 149 E Grand Ave
- 11 Hillcrest Ave
- 13 Woodland Ave
- 16 Hillcrest Ave