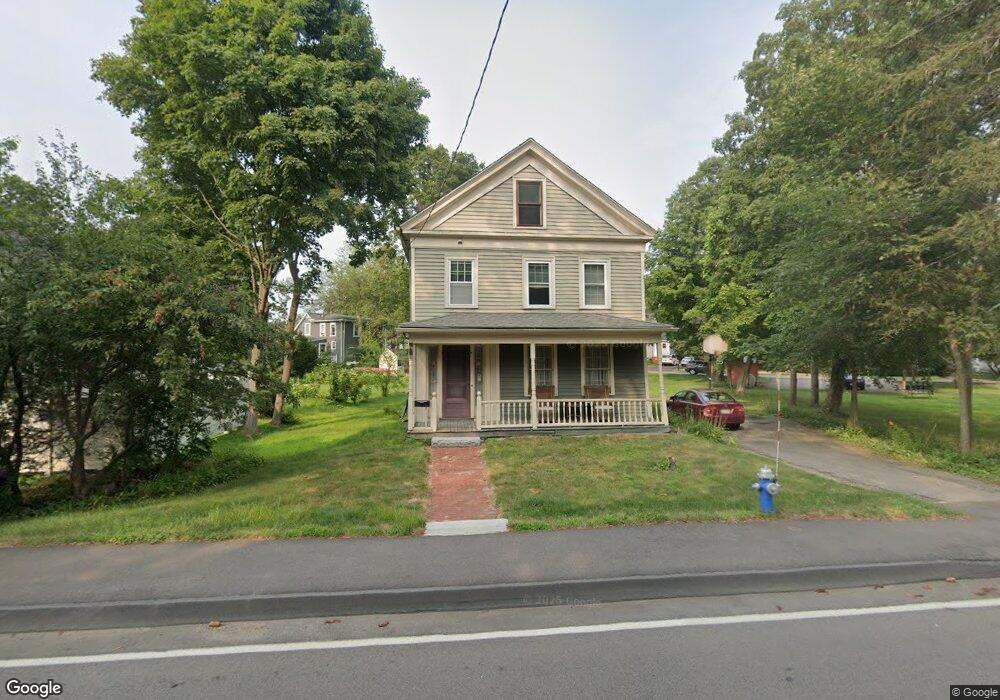
6 Holliston St Unit 2 Medway, MA 02053
Estimated Value: $552,060 - $694,000
1
Bed
1
Bath
1,200
Sq Ft
$512/Sq Ft
Est. Value
About This Home
This home is located at 6 Holliston St Unit 2, Medway, MA 02053 and is currently estimated at $614,765, approximately $512 per square foot. 6 Holliston St Unit 2 is a home located in Norfolk County with nearby schools including John D. McGovern Elementary School, Burke-Memorial Elementary, and Medway Middle School.
Ownership History
Date
Name
Owned For
Owner Type
Purchase Details
Closed on
Mar 12, 2010
Sold by
West Steven D
Bought by
Pass Timothy M and Pass Tracey
Current Estimated Value
Home Financials for this Owner
Home Financials are based on the most recent Mortgage that was taken out on this home.
Original Mortgage
$267,633
Outstanding Balance
$177,736
Interest Rate
5.02%
Mortgage Type
Purchase Money Mortgage
Estimated Equity
$437,029
Purchase Details
Closed on
Aug 22, 2003
Sold by
Grupposo Philip R and Grupposo Ann Mt
Bought by
West Steven D
Home Financials for this Owner
Home Financials are based on the most recent Mortgage that was taken out on this home.
Original Mortgage
$274,550
Interest Rate
5.52%
Mortgage Type
Purchase Money Mortgage
Create a Home Valuation Report for This Property
The Home Valuation Report is an in-depth analysis detailing your home's value as well as a comparison with similar homes in the area
Home Values in the Area
Average Home Value in this Area
Purchase History
| Date | Buyer | Sale Price | Title Company |
|---|---|---|---|
| Pass Timothy M | $262,000 | -- | |
| West Steven D | $289,000 | -- |
Source: Public Records
Mortgage History
| Date | Status | Borrower | Loan Amount |
|---|---|---|---|
| Open | Pass Timothy M | $267,633 | |
| Previous Owner | West Steven D | $274,550 | |
| Previous Owner | West Steven D | $140,000 | |
| Previous Owner | West Steven D | $25,000 |
Source: Public Records
Tax History Compared to Growth
Tax History
| Year | Tax Paid | Tax Assessment Tax Assessment Total Assessment is a certain percentage of the fair market value that is determined by local assessors to be the total taxable value of land and additions on the property. | Land | Improvement |
|---|---|---|---|---|
| 2025 | $6,395 | $448,800 | $264,700 | $184,100 |
| 2024 | $6,463 | $448,800 | $264,700 | $184,100 |
| 2023 | $6,231 | $390,900 | $228,100 | $162,800 |
| 2022 | $5,993 | $354,000 | $203,600 | $150,400 |
| 2021 | $5,655 | $323,900 | $183,300 | $140,600 |
| 2020 | $5,432 | $310,400 | $162,900 | $147,500 |
| 2019 | $5,203 | $306,600 | $162,900 | $143,700 |
| 2018 | $5,146 | $291,400 | $142,600 | $148,800 |
| 2017 | $5,039 | $281,200 | $132,400 | $148,800 |
| 2016 | $4,928 | $272,100 | $127,500 | $144,600 |
| 2015 | $4,553 | $249,600 | $120,100 | $129,500 |
| 2014 | $4,629 | $245,700 | $117,400 | $128,300 |
Source: Public Records
Map
Nearby Homes
- 20 Broad St Unit 6
- 20 Broad St Unit A
- 20 Broad St Unit 4
- 14 Sanford St Unit 15
- 9 Sanford St
- 841 Lincoln St
- 50 Main St
- 56 Fuller Place
- 7 Gloucester Dr
- 280 Village St Unit D2
- 0 Elm St
- 4 Shaw St
- 3 Meryl St
- 2 Skyline Dr
- 22 Sunset Dr
- 16 Lexington Ln
- 106 Holliston St
- 732 Lincoln St
- 12 Lovering St
- 24 Shayne Rd Unit 219