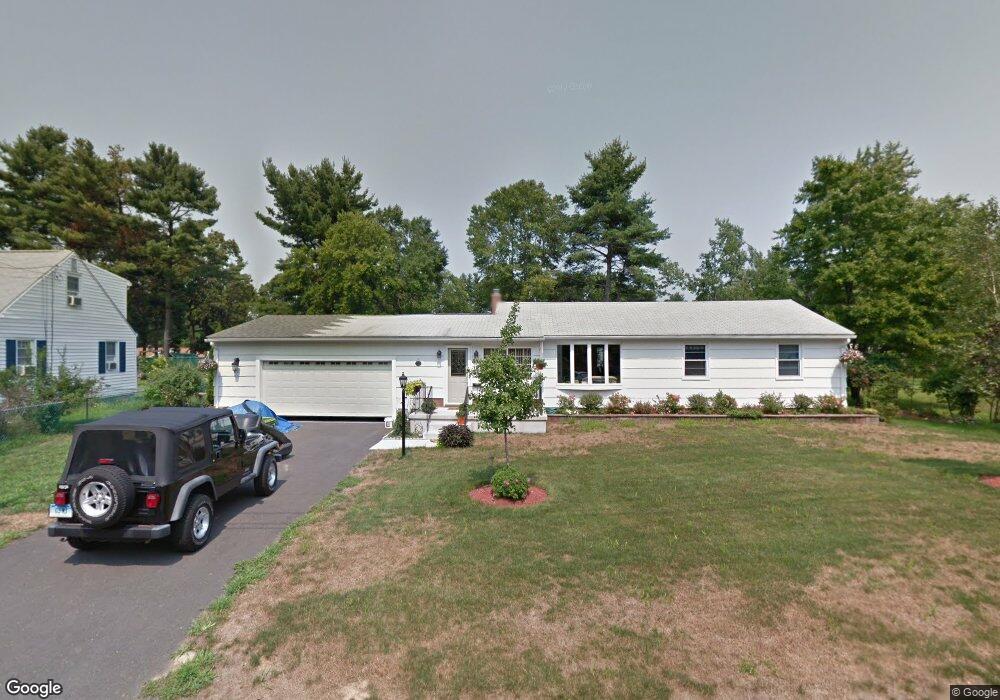
6 Howard St Enfield, CT 06082
Estimated Value: $313,790 - $330,000
3
Beds
1
Bath
1,230
Sq Ft
$263/Sq Ft
Est. Value
About This Home
This home is located at 6 Howard St, Enfield, CT 06082 and is currently estimated at $323,948, approximately $263 per square foot. 6 Howard St is a home located in Hartford County with nearby schools including Eli Whitney Elementary School, Hazardville Memorial Elementary School, and Enfield High School.
Ownership History
Date
Name
Owned For
Owner Type
Purchase Details
Closed on
Dec 9, 2021
Sold by
Sequenzia Antonina G
Bought by
Antonina G Sequenzia Irt and Sequenzia
Current Estimated Value
Purchase Details
Closed on
Jul 20, 2020
Sold by
Raffia Mary J
Bought by
Raffia Mary J and Raffia Gary J
Purchase Details
Closed on
Jul 22, 1993
Sold by
Cantania Mary Jane
Bought by
Lonewski Jane
Create a Home Valuation Report for This Property
The Home Valuation Report is an in-depth analysis detailing your home's value as well as a comparison with similar homes in the area
Home Values in the Area
Average Home Value in this Area
Purchase History
| Date | Buyer | Sale Price | Title Company |
|---|---|---|---|
| Antonina G Sequenzia Irt | -- | None Available | |
| Raffia Mary J | -- | None Available | |
| Raffia Mary J | -- | None Available | |
| Lonewski Jane | $68,152 | -- | |
| Lonewski Jane | $68,152 | -- |
Source: Public Records
Mortgage History
| Date | Status | Borrower | Loan Amount |
|---|---|---|---|
| Previous Owner | Lonewski Jane | $24,468 |
Source: Public Records
Tax History
| Year | Tax Paid | Tax Assessment Tax Assessment Total Assessment is a certain percentage of the fair market value that is determined by local assessors to be the total taxable value of land and additions on the property. | Land | Improvement |
|---|---|---|---|---|
| 2025 | $5,098 | $145,700 | $56,600 | $89,100 |
| 2024 | $4,961 | $145,700 | $56,600 | $89,100 |
| 2023 | $4,925 | $145,700 | $56,600 | $89,100 |
| 2022 | $4,472 | $145,700 | $56,600 | $89,100 |
| 2021 | $4,297 | $114,500 | $46,890 | $67,610 |
| 2020 | $4,297 | $114,500 | $46,890 | $67,610 |
| 2019 | $4,309 | $114,500 | $46,890 | $67,610 |
| 2018 | $4,237 | $114,500 | $46,890 | $67,610 |
| 2017 | $3,999 | $114,500 | $46,890 | $67,610 |
| 2016 | $4,070 | $118,620 | $48,110 | $70,510 |
| 2015 | $3,943 | $118,620 | $48,110 | $70,510 |
| 2014 | $3,841 | $118,620 | $48,110 | $70,510 |
Source: Public Records
Map
Nearby Homes
Your Personal Tour Guide
Ask me questions while you tour the home.