Estimated Value: $398,238 - $599,000
--
Bed
1
Bath
3,108
Sq Ft
$170/Sq Ft
Est. Value
About This Home
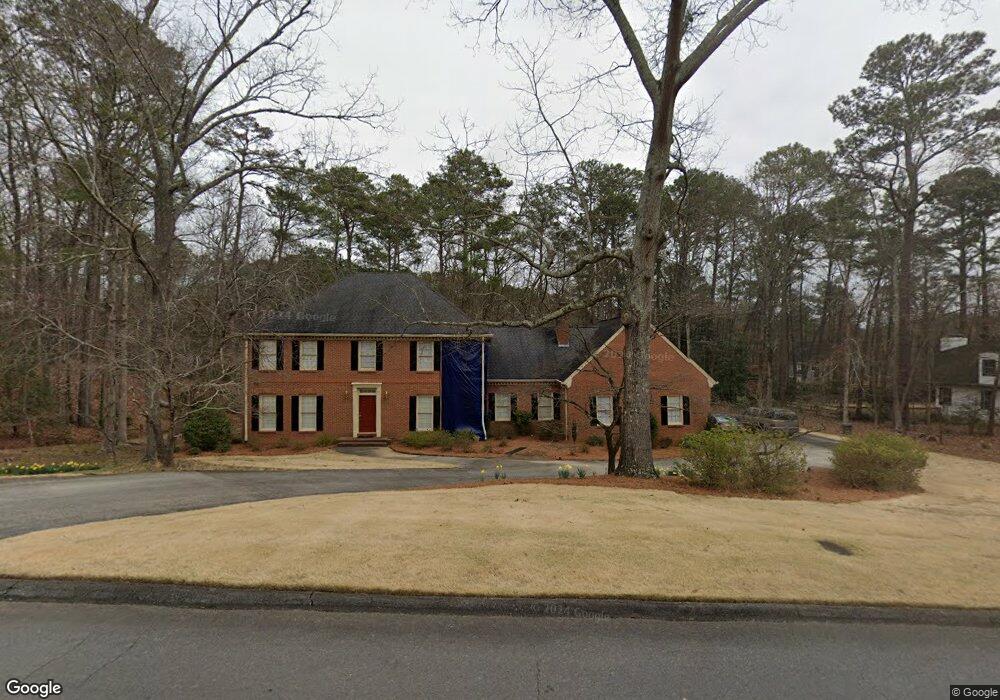
This home is located at 6 Huntington Rd SW, Rome, GA 30165 and is currently estimated at $528,060, approximately $169 per square foot. 6 Huntington Rd SW is a home located in Floyd County with nearby schools including Coosa Middle School and Coosa High School.
Ownership History
Date
Name
Owned For
Owner Type
Purchase Details
Closed on
Dec 27, 2006
Sold by
Not Provided
Bought by
Gosnell Harold C and Gosnell Michaeleen J
Current Estimated Value
Purchase Details
Closed on
Jun 8, 1998
Sold by
Gosnell Harold C and Gosne Michaeleen J
Bought by
Gosnell Michaeleen J
Purchase Details
Closed on
Sep 1, 1987
Sold by
Gosnell Harold C
Bought by
Gosnell Harold C and Gosnell Michaeleen J
Purchase Details
Closed on
Aug 13, 1980
Sold by
Watters J Tom
Bought by
Gosnell Harold C
Purchase Details
Closed on
May 10, 1979
Sold by
Smith Evans Lumber Company
Bought by
Watters J Tom
Purchase Details
Closed on
Mar 6, 1979
Sold by
Heritage Homes Of Rome Inc
Bought by
Smith Evans Lumber Company
Purchase Details
Closed on
Mar 17, 1978
Sold by
Sheron Toles Inc
Bought by
Heritage Homes Of Rome Inc
Purchase Details
Closed on
May 19, 1972
Bought by
Sheron Toles Inc
Create a Home Valuation Report for This Property
The Home Valuation Report is an in-depth analysis detailing your home's value as well as a comparison with similar homes in the area
Home Values in the Area
Average Home Value in this Area
Purchase History
| Date | Buyer | Sale Price | Title Company |
|---|---|---|---|
| Gosnell Harold C | -- | -- | |
| Gosnell Michaeleen J | -- | -- | |
| Gosnell Harold C | -- | -- | |
| Gosnell Harold C | $142,500 | -- | |
| Watters J Tom | $118,000 | -- | |
| Smith Evans Lumber Company | -- | -- | |
| Heritage Homes Of Rome Inc | $11,500 | -- | |
| Sheron Toles Inc | -- | -- |
Source: Public Records
Tax History Compared to Growth
Tax History
| Year | Tax Paid | Tax Assessment Tax Assessment Total Assessment is a certain percentage of the fair market value that is determined by local assessors to be the total taxable value of land and additions on the property. | Land | Improvement |
|---|---|---|---|---|
| 2024 | $3,051 | $154,772 | $23,925 | $130,847 |
| 2023 | $3,058 | $149,701 | $21,750 | $127,951 |
| 2022 | $2,638 | $124,946 | $18,038 | $106,908 |
| 2021 | $2,464 | $113,193 | $16,436 | $96,757 |
| 2020 | $2,495 | $114,037 | $14,292 | $99,745 |
| 2019 | $2,377 | $109,838 | $14,292 | $95,546 |
| 2018 | $2,283 | $104,732 | $13,612 | $91,120 |
| 2017 | $2,202 | $100,092 | $12,604 | $87,488 |
| 2016 | $2,111 | $93,720 | $12,600 | $81,120 |
| 2015 | $2,115 | $97,604 | $12,600 | $85,004 |
| 2014 | $2,115 | $97,604 | $12,600 | $85,004 |
Source: Public Records
Map
Nearby Homes
- 1 Huntington Rd SW
- 1 Windsor Rd SW
- 2 Kensington Rd SW
- 5 Saint Andrews Way SW
- 0 Belle Meade Dr SW Unit 10504645
- 5 Andrea Ct SW
- 10 Horseshoe Bend Rd SW
- 11 Brow Rd SW
- 0 Hidden Ridge Dr Unit 10556470
- 0 Hidden Ridge Dr Unit 10343706
- 0 Hidden Ridge Dr Unit 10343701
- 0 Hidden Ridge Dr Unit 10343700
- 0 Hidden Ridge Dr Unit 10343696
- 0 Hidden Ridge Dr Unit 10343694
- 0 Hidden Ridge Dr Unit 10343693
- 0 Hidden Ridge Dr Unit 10343689
- 0 Hidden Ridge Dr Unit 10343688
- 0 Hidden Ridge Dr Unit 10343685
- 0 Hidden Ridge Dr Unit 10343680
- 0 Hidden Ridge Dr Unit 10343676
- 4 Huntington Rd SW
- 8 Huntington Rd SW
- 1414 Horseleg Creek Rd SW
- 7 Huntington Rd SW
- 1442 Horseleg Creek Rd SW
- 10 Huntington Rd SW
- 5 Huntington Rd SW
- 9 Huntington Rd SW
- 3 Huntington Rd SW
- 1392 Horseleg Creek Rd SW
- 12 Huntington Rd SW
- 1449 Horseleg Creek Rd SW
- 1469 Horseleg Creek Rd SW
- 1439 Horseleg Creek Rd SW
- 11 Huntington Rd SW
- 1415 Horseleg Creek Rd SW
- 14 Huntington Rd SW
- 153 Whippoorwill Ln SW
- 171 Whippoorwill Ln SW
- 129 Whippoorwill Ln SW