Estimated Value: $722,892 - $908,000
3
Beds
2
Baths
1,575
Sq Ft
$494/Sq Ft
Est. Value
About This Home
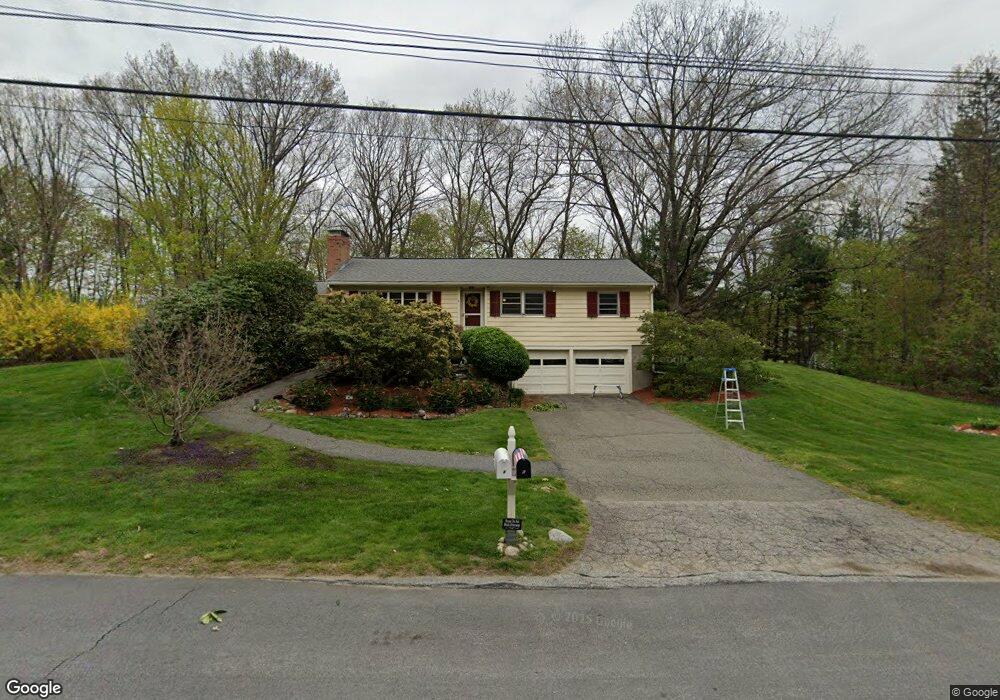
This home is located at 6 Huron Rd, Acton, MA 01720 and is currently estimated at $778,473, approximately $494 per square foot. 6 Huron Rd is a home located in Middlesex County with nearby schools including Acton-Boxborough Regional High School and Oak Meadow Montessori School.
Ownership History
Date
Name
Owned For
Owner Type
Purchase Details
Closed on
Jun 2, 1989
Sold by
Howard Steven C
Bought by
Jacobson Jay K
Current Estimated Value
Home Financials for this Owner
Home Financials are based on the most recent Mortgage that was taken out on this home.
Original Mortgage
$120,000
Interest Rate
10.92%
Mortgage Type
Purchase Money Mortgage
Create a Home Valuation Report for This Property
The Home Valuation Report is an in-depth analysis detailing your home's value as well as a comparison with similar homes in the area
Home Values in the Area
Average Home Value in this Area
Purchase History
| Date | Buyer | Sale Price | Title Company |
|---|---|---|---|
| Jacobson Jay K | $217,500 | -- |
Source: Public Records
Mortgage History
| Date | Status | Borrower | Loan Amount |
|---|---|---|---|
| Open | Jacobson Jay K | $220,000 | |
| Closed | Jacobson Jay K | $120,000 | |
| Closed | Jacobson Jay K | $118,500 | |
| Closed | Jacobson Jay K | $120,000 |
Source: Public Records
Tax History
| Year | Tax Paid | Tax Assessment Tax Assessment Total Assessment is a certain percentage of the fair market value that is determined by local assessors to be the total taxable value of land and additions on the property. | Land | Improvement |
|---|---|---|---|---|
| 2025 | $10,808 | $630,200 | $315,100 | $315,100 |
| 2024 | $10,267 | $615,900 | $315,100 | $300,800 |
| 2023 | $9,807 | $558,500 | $286,400 | $272,100 |
| 2022 | $9,929 | $510,500 | $249,100 | $261,400 |
| 2021 | $9,490 | $469,100 | $230,700 | $238,400 |
| 2020 | $8,804 | $457,600 | $230,700 | $226,900 |
| 2019 | $8,335 | $430,300 | $230,700 | $199,600 |
| 2018 | $7,725 | $398,600 | $230,700 | $167,900 |
| 2017 | $7,597 | $398,600 | $230,700 | $167,900 |
| 2016 | $7,265 | $377,800 | $230,700 | $147,100 |
| 2015 | $7,189 | $377,400 | $230,700 | $146,700 |
| 2014 | $7,216 | $371,000 | $230,700 | $140,300 |
Source: Public Records
Map
Nearby Homes
- 60 Nashoba Rd
- 4 Littlefield Rd
- 5 Perkins Ln
- 79 Charter Rd
- 20 Joseph Reed Ln
- 4 Omega Way
- 235 Arlington St
- 285 Central St Unit 285
- 18 Hayward Rd
- 11 Braebrook
- 246 Main St Unit 2
- 33 Meadowbrook Rd
- 7 Kelley Rd
- 92 Willow St Unit 3
- 92 Willow St Unit 2
- 90 Willow St Unit 1
- 305 Harwood Ave
- 46 Taylor Rd
- 491 Main St
- 524 Main St
Your Personal Tour Guide
Ask me questions while you tour the home.