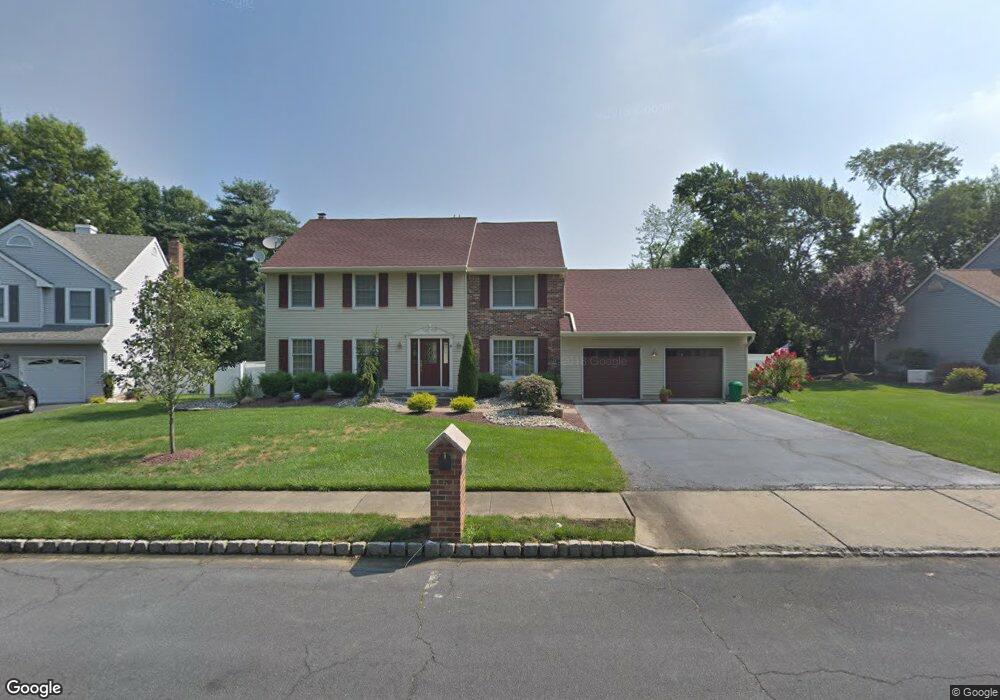
6 Ithaca Ct Matawan, NJ 07747
Estimated Value: $854,000 - $962,000
4
Beds
2
Baths
2,514
Sq Ft
$363/Sq Ft
Est. Value
About This Home
This home is located at 6 Ithaca Ct, Matawan, NJ 07747 and is currently estimated at $913,640, approximately $363 per square foot. 6 Ithaca Ct is a home located in Monmouth County with nearby schools including Matawan Reg High School, St Benedict School, and St. Joseph Elementary School.
Ownership History
Date
Name
Owned For
Owner Type
Purchase Details
Closed on
Jun 12, 2023
Sold by
Albro John T and Albro Christine
Bought by
Albro John T and Albro Christine
Current Estimated Value
Purchase Details
Closed on
Sep 28, 1989
Bought by
Albro John and Albro Christine
Create a Home Valuation Report for This Property
The Home Valuation Report is an in-depth analysis detailing your home's value as well as a comparison with similar homes in the area
Home Values in the Area
Average Home Value in this Area
Purchase History
| Date | Buyer | Sale Price | Title Company |
|---|---|---|---|
| Albro John T | -- | None Listed On Document | |
| Albro John | $276,800 | -- |
Source: Public Records
Tax History
| Year | Tax Paid | Tax Assessment Tax Assessment Total Assessment is a certain percentage of the fair market value that is determined by local assessors to be the total taxable value of land and additions on the property. | Land | Improvement |
|---|---|---|---|---|
| 2025 | $16,217 | $840,000 | $452,000 | $388,000 |
| 2024 | $16,808 | $802,400 | $421,500 | $380,900 |
Source: Public Records
Map
Nearby Homes
- 17 Idlebrook Ln
- 114 Dundee Ct
- 9 Amherst Ct
- 244 Lloyd Rd
- 72 Idlebrook Ln
- 99 Idlebrook Ln
- 537 S Atlantic Ave
- 315 Wellington Place
- 323 Arlene Terrace
- 283 Gloucester Ct
- 293 Gloucester Ct
- 292 Gloucester Ct
- 611 Wellington Place
- 14 W Aspen Way
- 39 W Aspen Way
- 5 7th St
- 28 Fayette Ln
- 414 Sloan Ct
- 326 Sloan Ct Unit 326
- 3 Tolas Dr
Your Personal Tour Guide
Ask me questions while you tour the home.