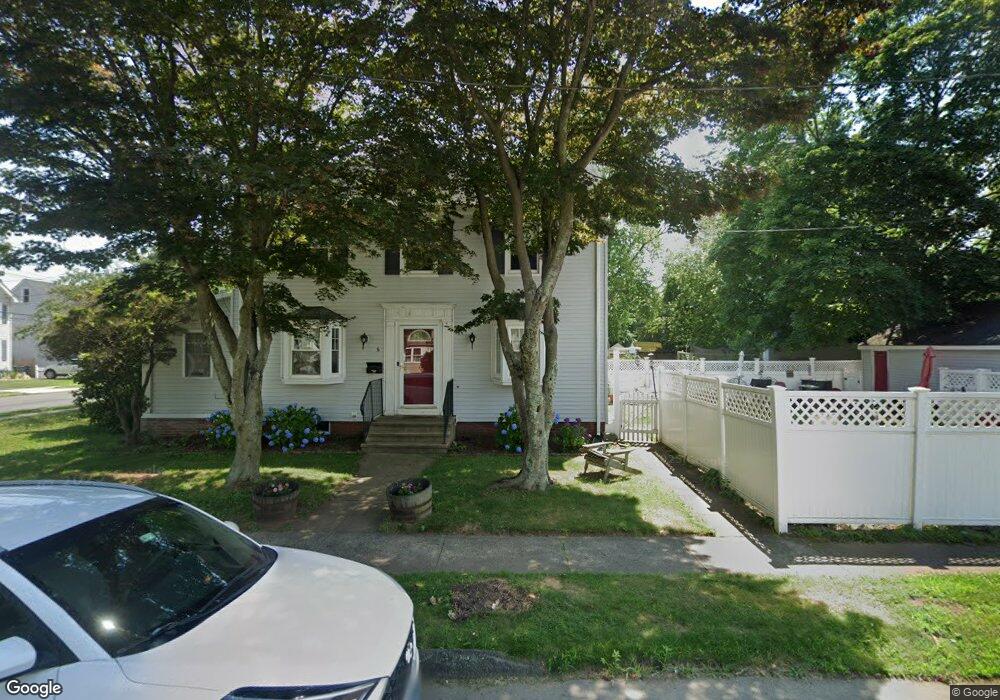
6 Iver Ave East Haven, CT 06512
Estimated Value: $359,000 - $376,000
3
Beds
2
Baths
1,468
Sq Ft
$250/Sq Ft
Est. Value
About This Home
This home is located at 6 Iver Ave, East Haven, CT 06512 and is currently estimated at $366,315, approximately $249 per square foot. 6 Iver Ave is a home located in New Haven County with nearby schools including East Haven High School, Cold Spring School, and Pathway School.
Ownership History
Date
Name
Owned For
Owner Type
Purchase Details
Closed on
Jun 13, 2014
Sold by
Higham Richard J
Bought by
Higham Jennifer H
Current Estimated Value
Purchase Details
Closed on
Nov 1, 2002
Sold by
Hague Susan D
Bought by
Higham Richard J and Higham Jennifer H
Create a Home Valuation Report for This Property
The Home Valuation Report is an in-depth analysis detailing your home's value as well as a comparison with similar homes in the area
Home Values in the Area
Average Home Value in this Area
Purchase History
| Date | Buyer | Sale Price | Title Company |
|---|---|---|---|
| Higham Jennifer H | -- | -- | |
| Higham Richard J | $160,000 | -- |
Source: Public Records
Mortgage History
| Date | Status | Borrower | Loan Amount |
|---|---|---|---|
| Open | Higham Richard J | $114,600 | |
| Previous Owner | Higham Richard J | $132,000 | |
| Previous Owner | Higham Richard J | $125,000 | |
| Previous Owner | Higham Richard J | $50,000 |
Source: Public Records
Tax History Compared to Growth
Tax History
| Year | Tax Paid | Tax Assessment Tax Assessment Total Assessment is a certain percentage of the fair market value that is determined by local assessors to be the total taxable value of land and additions on the property. | Land | Improvement |
|---|---|---|---|---|
| 2025 | $5,559 | $166,250 | $47,040 | $119,210 |
| 2024 | $5,559 | $166,250 | $47,040 | $119,210 |
| 2023 | $5,187 | $166,250 | $47,040 | $119,210 |
| 2022 | $5,187 | $166,250 | $47,040 | $119,210 |
| 2021 | $4,828 | $140,960 | $48,390 | $92,570 |
| 2020 | $4,828 | $140,960 | $48,390 | $92,570 |
| 2019 | $4,570 | $140,960 | $48,390 | $92,570 |
| 2018 | $4,574 | $140,960 | $48,390 | $92,570 |
| 2017 | $4,447 | $140,960 | $48,390 | $92,570 |
| 2016 | $4,392 | $139,210 | $47,040 | $92,170 |
| 2015 | $4,392 | $139,210 | $47,040 | $92,170 |
| 2014 | $4,462 | $139,210 | $47,040 | $92,170 |
Source: Public Records
Map
Nearby Homes
- 374 Thompson Ave
- 7 Iver Ave
- 14 Iver Ave
- 370 Thompson Ave
- 388 Thompson Ave
- 366 Thompson Ave
- 18 Iver Ave
- 375 Thompson Ave
- 383 Thompson Ave
- 13 Iver Ave
- 371 Thompson Ave
- 22 Iver Ave
- 367 Thompson Ave
- 394 Thompson Ave
- 360 Thompson Ave
- 387 Thompson Ave
- 24 Iver Ave
- 13 Carlson Place
- 17 Iver Ave
- 363 Thompson Ave