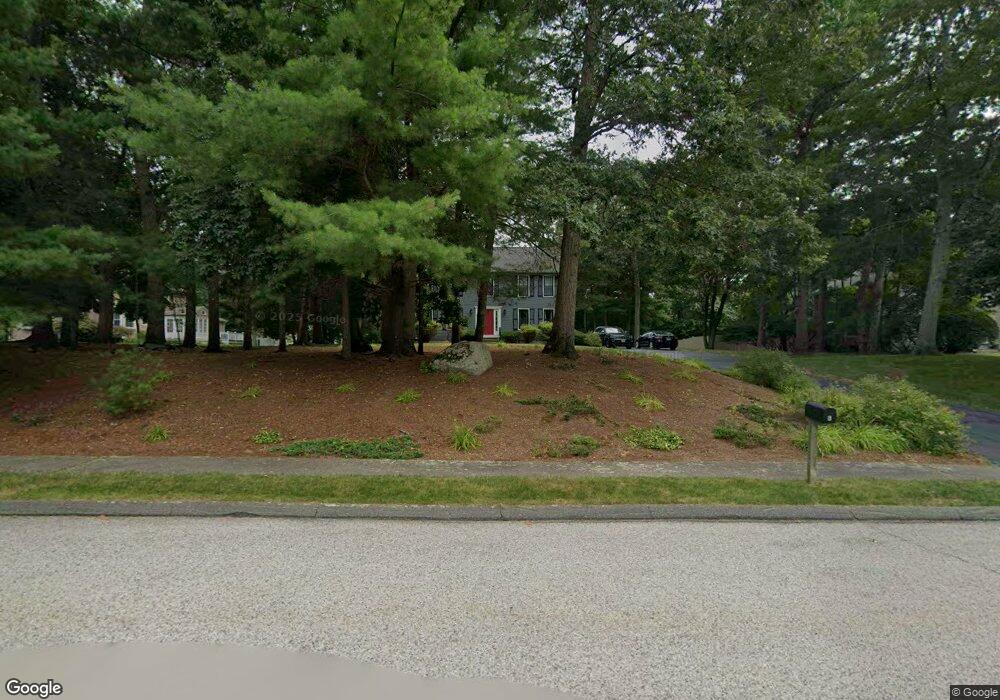
6 Jacob Dr Mansfield, MA 02048
Estimated Value: $771,355 - $948,000
4
Beds
3
Baths
2,119
Sq Ft
$412/Sq Ft
Est. Value
About This Home
This home is located at 6 Jacob Dr, Mansfield, MA 02048 and is currently estimated at $872,339, approximately $411 per square foot. 6 Jacob Dr is a home located in Bristol County with nearby schools including Everett W. Robinson Elementary School, Jordan/Jackson Elementary School, and Harold L. Qualters Middle School.
Ownership History
Date
Name
Owned For
Owner Type
Purchase Details
Closed on
Jul 26, 1991
Sold by
Gilman Thomas H and Gilman Lee
Bought by
Robertson Gerard J and Robertson Jessica
Current Estimated Value
Home Financials for this Owner
Home Financials are based on the most recent Mortgage that was taken out on this home.
Original Mortgage
$178,200
Interest Rate
9.58%
Mortgage Type
Purchase Money Mortgage
Create a Home Valuation Report for This Property
The Home Valuation Report is an in-depth analysis detailing your home's value as well as a comparison with similar homes in the area
Home Values in the Area
Average Home Value in this Area
Purchase History
| Date | Buyer | Sale Price | Title Company |
|---|---|---|---|
| Robertson Gerard J | $198,000 | -- |
Source: Public Records
Mortgage History
| Date | Status | Borrower | Loan Amount |
|---|---|---|---|
| Open | Robertson Gerard J | $345,500 | |
| Closed | Robertson Gerard J | $183,000 | |
| Closed | Robertson Gerard J | $178,200 |
Source: Public Records
Tax History Compared to Growth
Tax History
| Year | Tax Paid | Tax Assessment Tax Assessment Total Assessment is a certain percentage of the fair market value that is determined by local assessors to be the total taxable value of land and additions on the property. | Land | Improvement |
|---|---|---|---|---|
| 2025 | $9,178 | $696,900 | $266,000 | $430,900 |
| 2024 | $9,150 | $677,800 | $278,100 | $399,700 |
| 2023 | $8,839 | $627,300 | $278,100 | $349,200 |
| 2022 | $8,489 | $559,600 | $257,400 | $302,200 |
| 2021 | $3,425 | $565,800 | $242,600 | $323,200 |
| 2020 | $5,491 | $557,200 | $242,600 | $314,600 |
| 2019 | $8,261 | $542,800 | $225,300 | $317,500 |
| 2018 | $3,087 | $526,700 | $214,900 | $311,800 |
| 2017 | $7,692 | $512,100 | $208,800 | $303,300 |
| 2016 | $7,851 | $509,500 | $229,000 | $280,500 |
| 2015 | $7,676 | $495,200 | $229,000 | $266,200 |
Source: Public Records
Map
Nearby Homes