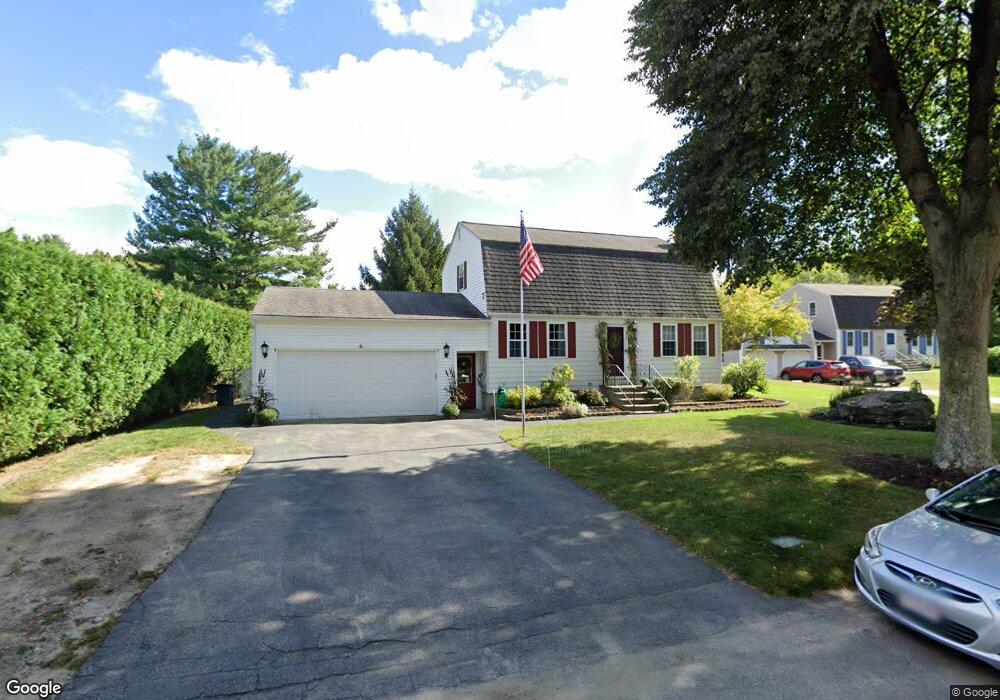
6 Jewel Cir Methuen, MA 01844
The West End NeighborhoodEstimated Value: $670,000 - $726,000
3
Beds
3
Baths
2,013
Sq Ft
$342/Sq Ft
Est. Value
About This Home
This home is located at 6 Jewel Cir, Methuen, MA 01844 and is currently estimated at $688,025, approximately $341 per square foot. 6 Jewel Cir is a home located in Essex County with nearby schools including Marsh Grammar School, South Point Elementary School, and Methuen High School.
Ownership History
Date
Name
Owned For
Owner Type
Purchase Details
Closed on
Sep 4, 2009
Sold by
Hardy Richard F and Hardy Tina M
Bought by
Mathieu Bobby G and Mathieu Marie Josee
Current Estimated Value
Home Financials for this Owner
Home Financials are based on the most recent Mortgage that was taken out on this home.
Original Mortgage
$292,500
Interest Rate
5.21%
Mortgage Type
Purchase Money Mortgage
Purchase Details
Closed on
Mar 27, 1992
Sold by
Hardy Debra A
Bought by
Hardy Richard F
Create a Home Valuation Report for This Property
The Home Valuation Report is an in-depth analysis detailing your home's value as well as a comparison with similar homes in the area
Home Values in the Area
Average Home Value in this Area
Purchase History
| Date | Buyer | Sale Price | Title Company |
|---|---|---|---|
| Mathieu Bobby G | $325,000 | -- | |
| Mathieu Bobby G | $325,000 | -- | |
| Hardy Richard F | $42,500 | -- | |
| Hardy Richard F | $42,500 | -- |
Source: Public Records
Mortgage History
| Date | Status | Borrower | Loan Amount |
|---|---|---|---|
| Open | Hardy Richard F | $288,000 | |
| Closed | Mathieu Bobby G | $292,500 |
Source: Public Records
Tax History Compared to Growth
Tax History
| Year | Tax Paid | Tax Assessment Tax Assessment Total Assessment is a certain percentage of the fair market value that is determined by local assessors to be the total taxable value of land and additions on the property. | Land | Improvement |
|---|---|---|---|---|
| 2025 | $5,863 | $554,200 | $243,800 | $310,400 |
| 2024 | $5,737 | $528,300 | $221,600 | $306,700 |
| 2023 | $5,469 | $467,400 | $197,900 | $269,500 |
| 2022 | $5,033 | $385,700 | $158,300 | $227,400 |
| 2021 | $4,890 | $370,700 | $150,400 | $220,300 |
| 2020 | $4,767 | $354,700 | $150,400 | $204,300 |
| 2019 | $4,606 | $324,600 | $142,500 | $182,100 |
| 2018 | $4,478 | $313,800 | $142,500 | $171,300 |
| 2017 | $4,515 | $308,200 | $142,500 | $165,700 |
| 2016 | $4,483 | $302,700 | $142,500 | $160,200 |
| 2015 | $4,338 | $297,100 | $142,500 | $154,600 |
Source: Public Records
Map
Nearby Homes