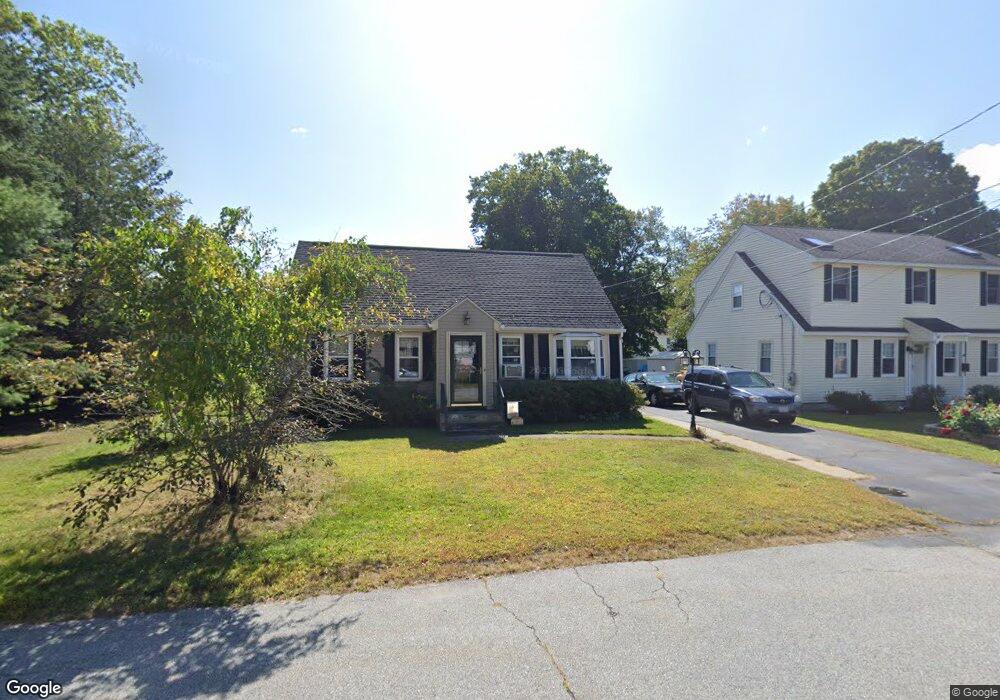
6 John St Millbury, MA 01527
Estimated Value: $391,000 - $470,000
4
Beds
1
Bath
1,382
Sq Ft
$318/Sq Ft
Est. Value
About This Home
This home is located at 6 John St, Millbury, MA 01527 and is currently estimated at $439,797, approximately $318 per square foot. 6 John St is a home located in Worcester County with nearby schools including Elmwood Street Elementary School, Raymond E. Shaw Elementary School, and Millbury Junior/Senior High School.
Ownership History
Date
Name
Owned For
Owner Type
Purchase Details
Closed on
Sep 4, 2001
Sold by
Cunniff Helene A Est and Crowley
Bought by
Mandella Edward H and Mandella Stacy L
Current Estimated Value
Home Financials for this Owner
Home Financials are based on the most recent Mortgage that was taken out on this home.
Original Mortgage
$165,194
Interest Rate
7.06%
Mortgage Type
Purchase Money Mortgage
Create a Home Valuation Report for This Property
The Home Valuation Report is an in-depth analysis detailing your home's value as well as a comparison with similar homes in the area
Home Values in the Area
Average Home Value in this Area
Purchase History
| Date | Buyer | Sale Price | Title Company |
|---|---|---|---|
| Mandella Edward H | $166,500 | -- | |
| Mandella Edward H | $166,500 | -- |
Source: Public Records
Mortgage History
| Date | Status | Borrower | Loan Amount |
|---|---|---|---|
| Open | Mandella Edward H | $184,800 | |
| Closed | Mandella Edward H | $183,600 | |
| Closed | Mandella Edward H | $165,194 |
Source: Public Records
Tax History
| Year | Tax Paid | Tax Assessment Tax Assessment Total Assessment is a certain percentage of the fair market value that is determined by local assessors to be the total taxable value of land and additions on the property. | Land | Improvement |
|---|---|---|---|---|
| 2025 | $5,229 | $390,500 | $113,800 | $276,700 |
| 2024 | $4,799 | $362,700 | $105,400 | $257,300 |
| 2023 | $4,481 | $310,100 | $74,000 | $236,100 |
| 2022 | $4,383 | $292,200 | $74,000 | $218,200 |
| 2021 | $4,288 | $277,900 | $74,000 | $203,900 |
| 2020 | $4,151 | $270,800 | $74,000 | $196,800 |
| 2019 | $3,677 | $232,000 | $67,200 | $164,800 |
| 2018 | $3,611 | $221,000 | $67,200 | $153,800 |
| 2017 | $3,215 | $195,700 | $67,200 | $128,500 |
| 2016 | $2,964 | $180,100 | $67,200 | $112,900 |
| 2015 | $2,986 | $181,400 | $71,400 | $110,000 |
| 2014 | $2,924 | $171,000 | $71,400 | $99,600 |
Source: Public Records
Map
Nearby Homes
- 12 Irene Ct
- 7 Barbara St
- 11 Maplewood Rd
- 1459 Grafton Rd
- 2 Diane St
- 8 Nightview Place
- 48 Macarthur Dr
- 182 Weatherstone Dr
- 7 Clarissa St
- 51 John Dr Unit 51
- 1195 Grafton St Unit 29
- 1195 Grafton St Unit 39
- 9 Marissa Cir
- 47 Ideal Rd
- 31 Blithewood Ave Unit 705
- 2 Wilson Rd Unit B
- 2 Wilson Rd Unit A
- 15 Lakeside Dr
- 270 Sunderland Rd Unit 73
- 33 Lakeside Dr