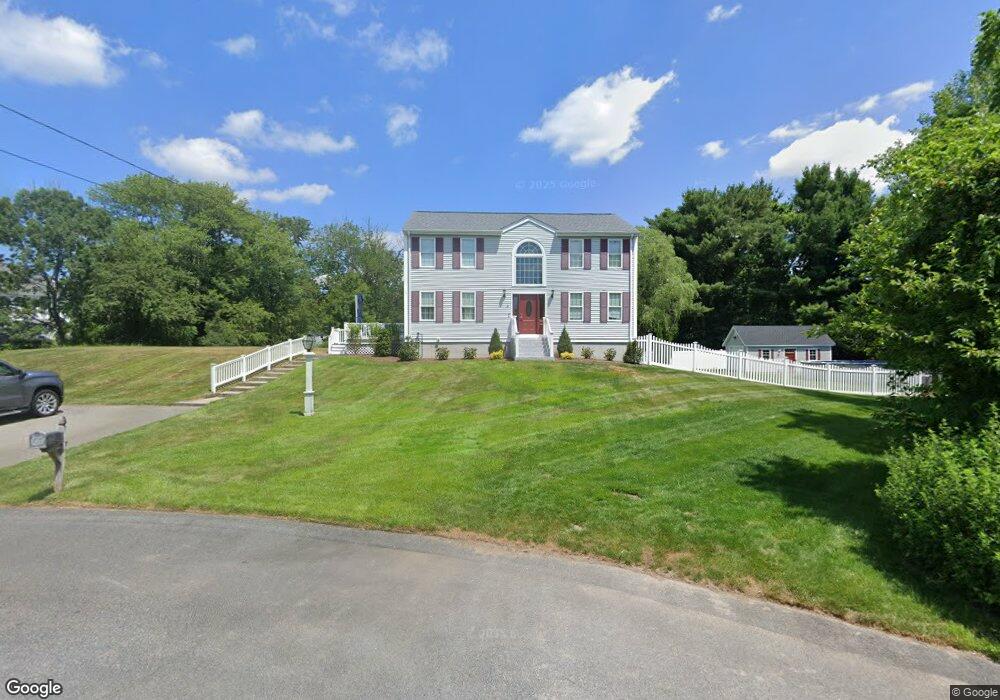
6 Jons Path East Bridgewater, MA 02333
Estimated Value: $651,170 - $709,000
3
Beds
2
Baths
1,900
Sq Ft
$357/Sq Ft
Est. Value
About This Home
This home is located at 6 Jons Path, East Bridgewater, MA 02333 and is currently estimated at $678,293, approximately $356 per square foot. 6 Jons Path is a home located in Plymouth County with nearby schools including Central Elementary School, Gordon W Mitchell Middle School, and East Bridgewater Jr./Sr. High School.
Ownership History
Date
Name
Owned For
Owner Type
Purchase Details
Closed on
Jun 19, 2025
Sold by
Ligols Rodd A and Ligols Cheryl M
Bought by
Ligols Ft and Damiecki
Current Estimated Value
Purchase Details
Closed on
Aug 28, 2002
Sold by
Bobco Rt and Mesiterman
Bought by
Ligols Rodd A and Ligols Cheryl M
Purchase Details
Closed on
Jan 24, 2002
Sold by
Overstreet H Paul and Overstreet Lu A M
Bought by
Bobco Rt and Meisterman Robert J
Create a Home Valuation Report for This Property
The Home Valuation Report is an in-depth analysis detailing your home's value as well as a comparison with similar homes in the area
Home Values in the Area
Average Home Value in this Area
Purchase History
| Date | Buyer | Sale Price | Title Company |
|---|---|---|---|
| Ligols Ft | -- | None Available | |
| Ligols Ft | -- | None Available | |
| Ligols Rodd A | $320,000 | -- | |
| Ligols Rodd A | $320,000 | -- | |
| Bobco Rt | $85,000 | -- | |
| Bobco Rt | $85,000 | -- |
Source: Public Records
Mortgage History
| Date | Status | Borrower | Loan Amount |
|---|---|---|---|
| Previous Owner | Bobco Rt | $272,400 | |
| Previous Owner | Bobco Rt | $50,000 | |
| Previous Owner | Bobco Rt | $299,000 |
Source: Public Records
Tax History Compared to Growth
Tax History
| Year | Tax Paid | Tax Assessment Tax Assessment Total Assessment is a certain percentage of the fair market value that is determined by local assessors to be the total taxable value of land and additions on the property. | Land | Improvement |
|---|---|---|---|---|
| 2025 | $7,863 | $575,200 | $225,500 | $349,700 |
| 2024 | $7,712 | $557,200 | $216,800 | $340,400 |
| 2023 | $7,614 | $526,900 | $216,800 | $310,100 |
| 2022 | $7,128 | $456,900 | $180,800 | $276,100 |
| 2021 | $6,987 | $409,800 | $173,700 | $236,100 |
| 2020 | $6,859 | $396,700 | $167,000 | $229,700 |
| 2019 | $6,690 | $381,000 | $159,600 | $221,400 |
| 2018 | $6,496 | $361,700 | $159,600 | $202,100 |
| 2017 | $6,350 | $347,000 | $152,200 | $194,800 |
| 2016 | $6,156 | $339,000 | $152,200 | $186,800 |
| 2015 | $5,974 | $336,400 | $151,200 | $185,200 |
| 2014 | $5,791 | $333,400 | $148,000 | $185,400 |
Source: Public Records
Map
Nearby Homes
- 1247 Central St
- 170 Elm St
- 9 Daisy Ln
- 5 Della Way
- 844 Washington St
- 936 Central St
- 1 Simmons Place
- 182 Crystal Water Dr Unit 182
- 217 Crystal Water Dr
- 28 Brookbend Way E
- 1993 Washington St
- 51 Stonegate Dr
- 78 Crystal Water Dr
- 71 Stonegate Dr
- 587 Bridge St
- 72 Phillips St
- 80 Phillips St
- 22 Hudson St
- 2045 Washington St
- 14 Mountain Ash Rd