Estimated Value: $1,038,530 - $1,230,000
2
Beds
2
Baths
1,224
Sq Ft
$949/Sq Ft
Est. Value
About This Home
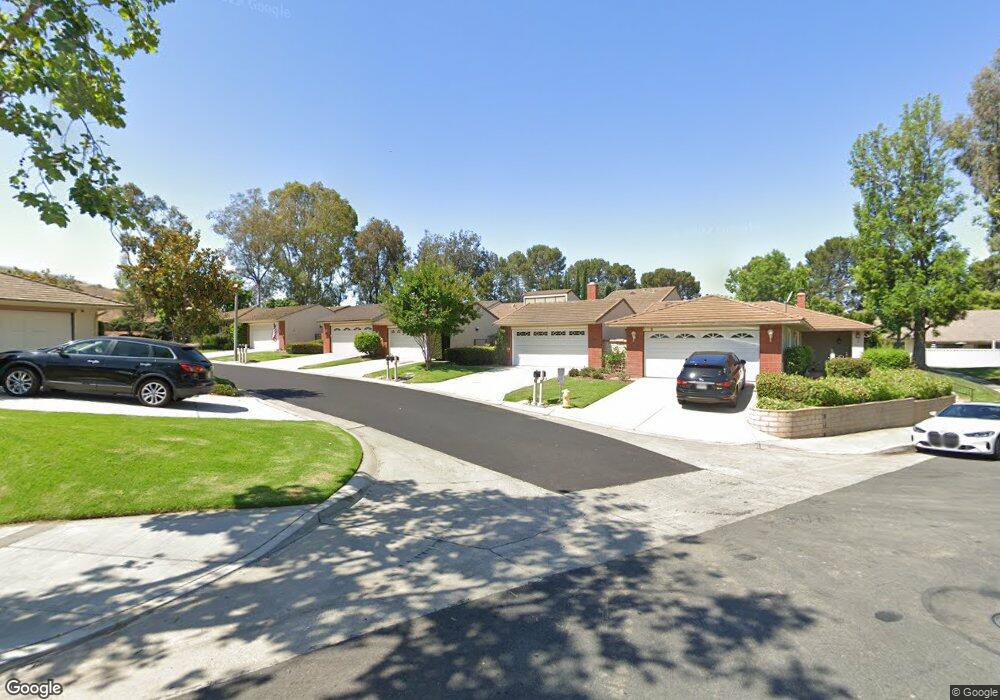
This home is located at 6 Juniper, Irvine, CA 92612 and is currently estimated at $1,161,633, approximately $949 per square foot. 6 Juniper is a home located in Orange County with nearby schools including University Park Elementary, Rancho San Joaquin Middle School, and University High School.
Ownership History
Date
Name
Owned For
Owner Type
Purchase Details
Closed on
Feb 14, 2026
Sold by
Acone Jonathan
Bought by
Jonathan And Alison Acone Trust and Acone
Current Estimated Value
Purchase Details
Closed on
Jul 17, 2024
Sold by
Acone Adam H
Bought by
Adam H Acone Living Trust and Acone
Purchase Details
Closed on
Apr 30, 2021
Sold by
Acone Jonathan P and Acone Adam H
Bought by
Acone Jonathan P and Acone Adam H
Purchase Details
Closed on
Sep 6, 2001
Sold by
Acone Paul Adam and Acone Nancy Mae
Bought by
Acone Paul Adam and Acone Nancy Mae
Create a Home Valuation Report for This Property
The Home Valuation Report is an in-depth analysis detailing your home's value as well as a comparison with similar homes in the area
Home Values in the Area
Average Home Value in this Area
Purchase History
| Date | Buyer | Sale Price | Title Company |
|---|---|---|---|
| Jonathan And Alison Acone Trust | -- | None Listed On Document | |
| Adam H Acone Living Trust | -- | None Listed On Document | |
| Acone Jonathan P | -- | None Available | |
| Acone Paul Adam | -- | -- | |
| Acone Paul Adam | -- | -- |
Source: Public Records
Tax History
| Year | Tax Paid | Tax Assessment Tax Assessment Total Assessment is a certain percentage of the fair market value that is determined by local assessors to be the total taxable value of land and additions on the property. | Land | Improvement |
|---|---|---|---|---|
| 2025 | $1,285 | $114,480 | $46,109 | $68,371 |
| 2024 | $1,285 | $112,236 | $45,205 | $67,031 |
| 2023 | $1,252 | $110,036 | $44,319 | $65,717 |
| 2022 | $1,229 | $107,879 | $43,450 | $64,429 |
| 2021 | $1,201 | $105,764 | $42,598 | $63,166 |
| 2020 | $1,193 | $104,680 | $42,161 | $62,519 |
| 2019 | $1,168 | $102,628 | $41,334 | $61,294 |
| 2018 | $1,144 | $100,616 | $40,523 | $60,093 |
| 2017 | $1,119 | $98,644 | $39,729 | $58,915 |
| 2016 | $1,072 | $96,710 | $38,950 | $57,760 |
| 2015 | $1,056 | $95,258 | $38,365 | $56,893 |
| 2014 | $1,036 | $93,393 | $37,614 | $55,779 |
Source: Public Records
Map
Nearby Homes
Your Personal Tour Guide
Ask me questions while you tour the home.