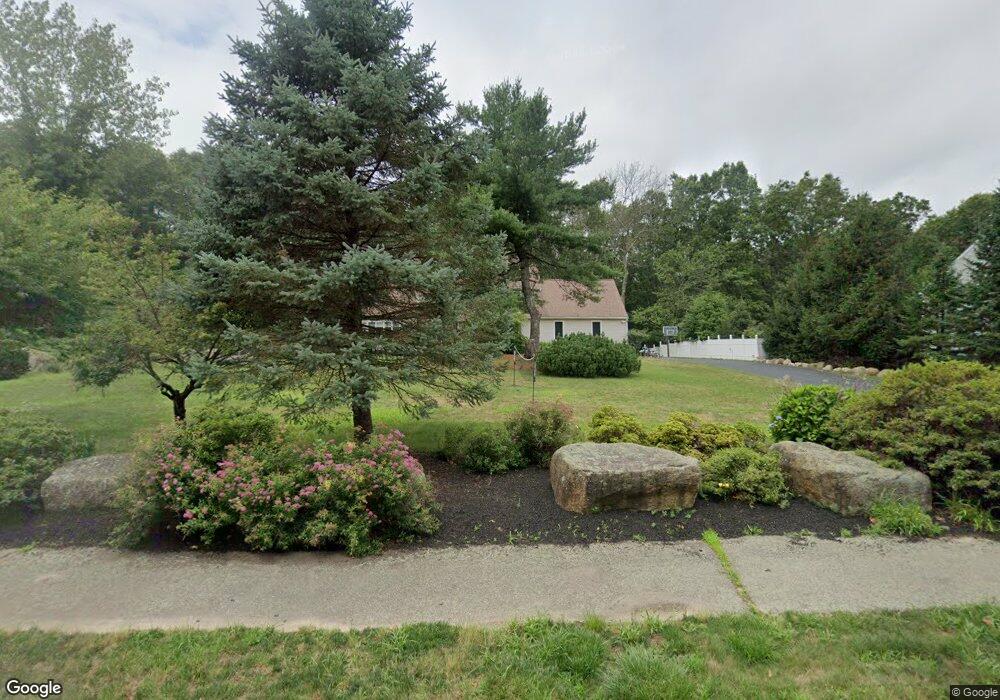
6 Juniper Rd Sharon, MA 02067
Estimated Value: $1,097,000 - $1,280,000
4
Beds
3
Baths
2,805
Sq Ft
$419/Sq Ft
Est. Value
About This Home
This home is located at 6 Juniper Rd, Sharon, MA 02067 and is currently estimated at $1,176,199, approximately $419 per square foot. 6 Juniper Rd is a home located in Norfolk County with nearby schools including East Elementary School, Sharon Middle School, and Sharon High School.
Ownership History
Date
Name
Owned For
Owner Type
Purchase Details
Closed on
Jan 21, 2021
Sold by
Kafel Jaafar M and Kafel Ghada J
Bought by
Saini Tarun and Saini Niharika
Current Estimated Value
Home Financials for this Owner
Home Financials are based on the most recent Mortgage that was taken out on this home.
Original Mortgage
$456,500
Outstanding Balance
$407,141
Interest Rate
2.67%
Mortgage Type
Purchase Money Mortgage
Estimated Equity
$769,058
Purchase Details
Closed on
Nov 3, 1998
Sold by
Diluzio John W and Diluzio Christina J
Bought by
Kafel Jaafar M and Kafel Ghada J
Purchase Details
Closed on
Sep 5, 1989
Sold by
Lichtenstein David
Bought by
Diluzio John W
Create a Home Valuation Report for This Property
The Home Valuation Report is an in-depth analysis detailing your home's value as well as a comparison with similar homes in the area
Home Values in the Area
Average Home Value in this Area
Purchase History
| Date | Buyer | Sale Price | Title Company |
|---|---|---|---|
| Saini Tarun | $830,000 | None Available | |
| Kafel Jaafar M | $424,500 | -- | |
| Diluzio John W | $365,000 | -- |
Source: Public Records
Mortgage History
| Date | Status | Borrower | Loan Amount |
|---|---|---|---|
| Open | Saini Tarun | $456,500 | |
| Previous Owner | Diluzio John W | $150,000 | |
| Previous Owner | Diluzio John W | $440,000 |
Source: Public Records
Tax History
| Year | Tax Paid | Tax Assessment Tax Assessment Total Assessment is a certain percentage of the fair market value that is determined by local assessors to be the total taxable value of land and additions on the property. | Land | Improvement |
|---|---|---|---|---|
| 2025 | $17,099 | $978,200 | $466,500 | $511,700 |
| 2024 | $16,365 | $930,900 | $428,000 | $502,900 |
| 2023 | $15,194 | $817,300 | $400,200 | $417,100 |
| 2022 | $14,425 | $730,400 | $333,400 | $397,000 |
| 2021 | $13,876 | $679,200 | $314,400 | $364,800 |
| 2020 | $13,177 | $693,500 | $328,700 | $364,800 |
| 2019 | $12,999 | $669,700 | $278,200 | $391,500 |
| 2018 | $12,867 | $664,300 | $272,800 | $391,500 |
| 2017 | $12,686 | $646,600 | $255,100 | $391,500 |
| 2016 | $12,828 | $637,900 | $280,700 | $357,200 |
| 2015 | $12,655 | $623,400 | $280,800 | $342,600 |
| 2014 | $11,726 | $570,600 | $255,300 | $315,300 |
Source: Public Records
Map
Nearby Homes
- 22 Magnolia Rd
- 2 Sherwood Cir
- 70 Deerfield Rd
- 132 Massapoag Ave
- 11 Wilshire Dr
- 15 Paul Revere Rd
- 9 Williams Rd
- 157 Wilshire Dr
- 62 Bishop Rd
- 133 Ames St
- 61 Lincoln Rd
- 350 Mountain St
- 2 Palace Ct
- 58 Ames St
- 4 Robinette Rd
- 22 Ames Ct
- 5 Trowel Pond Shop Rd Unit C
- 63 Highland St
- 115 Kennedy Rd
- 32 Billings St Unit A
Your Personal Tour Guide
Ask me questions while you tour the home.