6 Juniper St Wareham, MA 02571
Estimated Value: $425,000 - $471,000
3
Beds
1
Bath
912
Sq Ft
$499/Sq Ft
Est. Value
About This Home
This home is located at 6 Juniper St, Wareham, MA 02571 and is currently estimated at $454,746, approximately $498 per square foot. 6 Juniper St is a home located in Plymouth County.
Ownership History
Date
Name
Owned For
Owner Type
Purchase Details
Closed on
Apr 8, 2011
Sold by
Katherine A Waitt Ft and Waitt
Bought by
Cheney Robert J
Current Estimated Value
Home Financials for this Owner
Home Financials are based on the most recent Mortgage that was taken out on this home.
Original Mortgage
$132,000
Outstanding Balance
$91,220
Interest Rate
4.99%
Mortgage Type
Purchase Money Mortgage
Estimated Equity
$363,526
Create a Home Valuation Report for This Property
The Home Valuation Report is an in-depth analysis detailing your home's value as well as a comparison with similar homes in the area
Purchase History
| Date | Buyer | Sale Price | Title Company |
|---|---|---|---|
| Cheney Robert J | $165,000 | -- | |
| Cheney Robert J | $165,000 | -- |
Source: Public Records
Mortgage History
| Date | Status | Borrower | Loan Amount |
|---|---|---|---|
| Open | Cheney Robert J | $132,000 | |
| Closed | Cheney Robert J | $132,000 |
Source: Public Records
Tax History
| Year | Tax Paid | Tax Assessment Tax Assessment Total Assessment is a certain percentage of the fair market value that is determined by local assessors to be the total taxable value of land and additions on the property. | Land | Improvement |
|---|---|---|---|---|
| 2025 | $3,798 | $364,500 | $128,500 | $236,000 |
| 2024 | $3,783 | $336,900 | $101,100 | $235,800 |
| 2023 | $3,422 | $301,500 | $91,800 | $209,700 |
| 2022 | $3,422 | $259,600 | $91,800 | $167,800 |
| 2021 | $3,387 | $251,800 | $91,800 | $160,000 |
| 2020 | $3,166 | $238,800 | $91,800 | $147,000 |
| 2019 | $3,057 | $230,000 | $90,900 | $139,100 |
| 2018 | $2,729 | $200,200 | $90,900 | $109,300 |
| 2017 | $2,541 | $188,900 | $90,900 | $98,000 |
| 2016 | $2,315 | $171,100 | $86,700 | $84,400 |
| 2015 | $2,236 | $171,100 | $86,700 | $84,400 |
| 2014 | $2,208 | $171,800 | $94,600 | $77,200 |
Source: Public Records
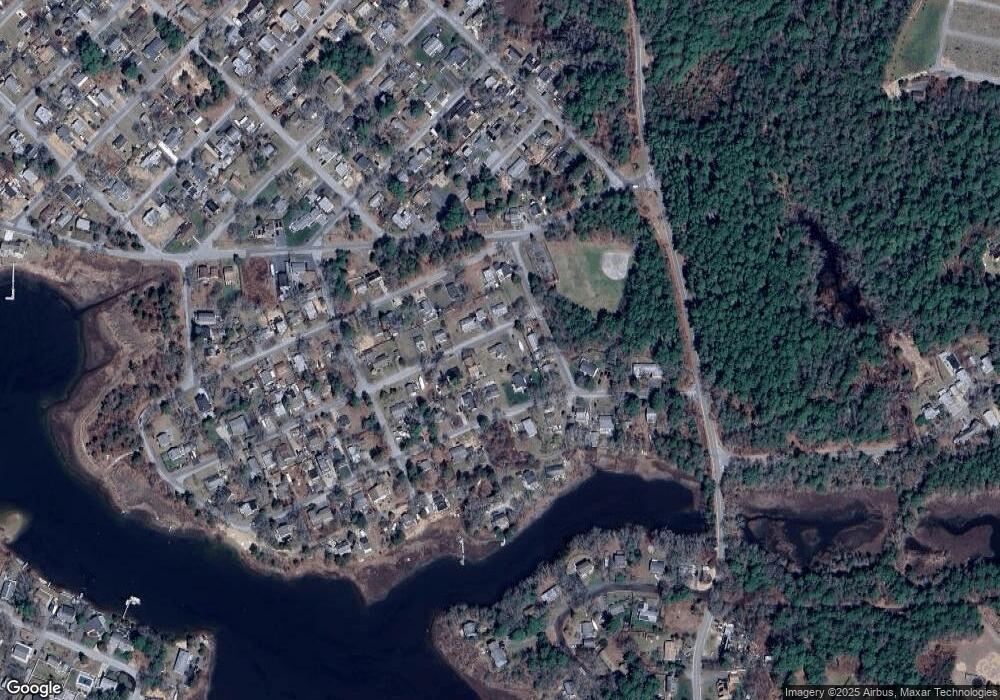
Map
Nearby Homes
Your Personal Tour Guide
Ask me questions while you tour the home.