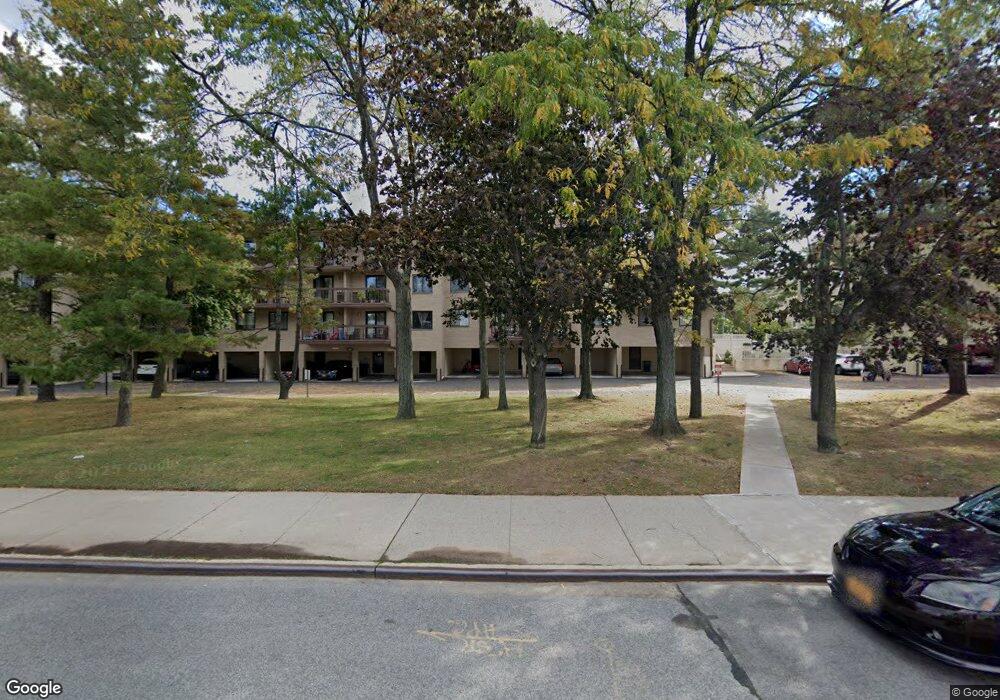
6 Kathy Place Unit 1A Staten Island, NY 10314
New Springville NeighborhoodEstimated Value: $466,128 - $505,000
2
Beds
2
Baths
1,068
Sq Ft
$456/Sq Ft
Est. Value
About This Home
This home is located at 6 Kathy Place Unit 1A, Staten Island, NY 10314 and is currently estimated at $487,282, approximately $456 per square foot. 6 Kathy Place Unit 1A is a home located in Richmond County with nearby schools including P.S. 58R Space Shuttle Columbia School, Is 72 Rocco Laurie, and Port Richmond High School.
Ownership History
Date
Name
Owned For
Owner Type
Purchase Details
Closed on
May 18, 2015
Sold by
Corrao Kimberly A and Kearns Kimberly A
Bought by
Mcentee Gerard
Current Estimated Value
Home Financials for this Owner
Home Financials are based on the most recent Mortgage that was taken out on this home.
Original Mortgage
$220,000
Outstanding Balance
$169,296
Interest Rate
3.65%
Mortgage Type
New Conventional
Estimated Equity
$317,987
Purchase Details
Closed on
Aug 12, 2009
Sold by
Napolitano Madeline
Bought by
Kearns Kimberly A
Home Financials for this Owner
Home Financials are based on the most recent Mortgage that was taken out on this home.
Original Mortgage
$215,000
Interest Rate
5.19%
Mortgage Type
New Conventional
Purchase Details
Closed on
Oct 24, 1997
Sold by
Montanino Rocco and Montanino Michael
Bought by
Napolitano Madeline
Create a Home Valuation Report for This Property
The Home Valuation Report is an in-depth analysis detailing your home's value as well as a comparison with similar homes in the area
Home Values in the Area
Average Home Value in this Area
Purchase History
| Date | Buyer | Sale Price | Title Company |
|---|---|---|---|
| Mcentee Gerard | $275,000 | Chicago Title Insurance Co | |
| Kearns Kimberly A | $269,000 | None Available | |
| Napolitano Madeline | $70,000 | -- |
Source: Public Records
Mortgage History
| Date | Status | Borrower | Loan Amount |
|---|---|---|---|
| Open | Mcentee Gerard | $220,000 | |
| Previous Owner | Kearns Kimberly A | $215,000 |
Source: Public Records
Tax History Compared to Growth
Tax History
| Year | Tax Paid | Tax Assessment Tax Assessment Total Assessment is a certain percentage of the fair market value that is determined by local assessors to be the total taxable value of land and additions on the property. | Land | Improvement |
|---|---|---|---|---|
| 2025 | $2,577 | $24,166 | $466 | $23,700 |
| 2024 | $2,577 | $23,568 | $474 | $23,094 |
| 2023 | $2,458 | $12,103 | $440 | $11,663 |
| 2022 | $2,280 | $21,318 | $871 | $20,447 |
| 2021 | $2,267 | $19,477 | $871 | $18,606 |
| 2020 | $2,281 | $19,709 | $871 | $18,838 |
| 2019 | $2,236 | $17,707 | $871 | $16,836 |
| 2018 | $2,056 | $10,086 | $516 | $9,570 |
| 2017 | $1,940 | $9,516 | $529 | $8,987 |
| 2016 | $1,795 | $8,978 | $524 | $8,454 |
| 2015 | -- | $8,978 | $439 | $8,539 |
| 2014 | -- | $8,909 | $591 | $8,318 |
Source: Public Records
Map
Nearby Homes
- 11 Windham Loop Unit 2DD
- 11 Windham Loop Unit 3II
- 11 Windham Loop Unit 2CC
- 5 Windham Loop Unit 3K
- 11 Windham Loop Unit 1NN
- 5 Windham Loop Unit 1E
- 85 Elmwood Park Dr Unit 2
- 463 Windham Loop
- 30 Donna Ct Unit 6
- 458 Windham Loop Unit O
- 17A Gregory Ln Unit 116
- 155A Devon Loop
- 2 Elmwood Park Dr Unit 404
- 2 Elmwood Park Dr Unit 610
- 120 Devon Loop Unit 6
- 171 Wellington Ct Unit 3B
- 89 Lott Ln
- 74 Belmar Dr W Unit 248E
- 4 Marisa Ct
- 42 Westport Ln
- 6 Kathy Place Unit 1B
- 6 Kathy Place Unit 3B
- 6 Kathy Place Unit 3A
- 6 Kathy Place Unit 2A
- 6 Kathy Place Unit 2B
- 6 Kathy Place Unit 1B
- 6 Kathy Place
- 2A Kathy Place Unit 2A
- 2 Kathy Place Unit 1A
- 2 Kathy Place Unit A
- 2 Kathy Place Unit 2A
- 10 Kathy Place Unit 2D
- 10 Kathy Place Unit 2D
- 10 Kathy Place Unit 2B
- 10 Kathy Place Unit 2A
- 10 Kathy Place Unit 1B
- 10 Kathy Place Unit 1A
- 10 Kathy Place
- 14 Kathy Place Unit 2D
- 14 Kathy Place Unit 2C