Estimated Value: $174,178 - $274,000
--
Bed
--
Bath
1,277
Sq Ft
$187/Sq Ft
Est. Value
About This Home
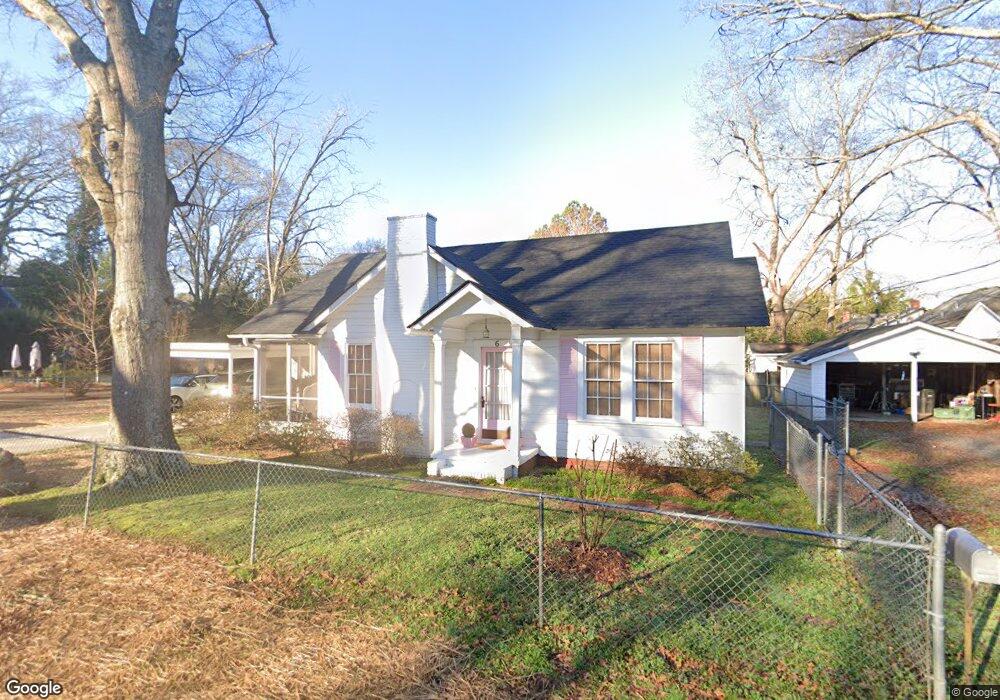
This home is located at 6 Kentucky Ave SE, Rome, GA 30161 and is currently estimated at $238,545, approximately $186 per square foot. 6 Kentucky Ave SE is a home located in Floyd County with nearby schools including Dan McCarty Middle School, Rome High School, and St. Mary School.
Ownership History
Date
Name
Owned For
Owner Type
Purchase Details
Closed on
Apr 20, 2015
Sold by
Carter Robert S
Bought by
Carter Robert S and Cato Winnifred Seery
Current Estimated Value
Purchase Details
Closed on
May 24, 1990
Sold by
Macleod Scott D
Bought by
Carter Robert S
Purchase Details
Closed on
Apr 6, 1989
Sold by
Annie Waters M and Annie Muriel
Bought by
Macleod Scott D
Purchase Details
Closed on
Nov 12, 1987
Sold by
Kennedy Estelle J
Bought by
Annie Waters M and Annie Muriel
Purchase Details
Closed on
Aug 4, 1971
Sold by
Harrington James H and Harrington Jacqueline R
Bought by
Kennedy Estelle J
Purchase Details
Closed on
Jul 31, 1968
Sold by
Hall Hall W and Hall Mildred
Bought by
Harrington James H and Harrington Jacqueline
Purchase Details
Closed on
Aug 18, 1967
Sold by
Mashburn James R
Bought by
Hall Hall W and Hall Mildred
Purchase Details
Closed on
Oct 30, 1964
Sold by
Hall W M
Bought by
Mashburn James R
Purchase Details
Closed on
Jan 1, 1901
Bought by
Hall W M
Create a Home Valuation Report for This Property
The Home Valuation Report is an in-depth analysis detailing your home's value as well as a comparison with similar homes in the area
Home Values in the Area
Average Home Value in this Area
Purchase History
| Date | Buyer | Sale Price | Title Company |
|---|---|---|---|
| Carter Robert S | -- | -- | |
| Carter Robert S | -- | -- | |
| Macleod Scott D | $59,000 | -- | |
| Annie Waters M | $56,000 | -- | |
| Kennedy Estelle J | $15,500 | -- | |
| Harrington James H | $12,500 | -- | |
| Hall Hall W | $4,400 | -- | |
| Mashburn James R | $11,000 | -- | |
| Hall W M | -- | -- |
Source: Public Records
Tax History Compared to Growth
Tax History
| Year | Tax Paid | Tax Assessment Tax Assessment Total Assessment is a certain percentage of the fair market value that is determined by local assessors to be the total taxable value of land and additions on the property. | Land | Improvement |
|---|---|---|---|---|
| 2024 | $1,170 | $70,596 | $9,548 | $61,048 |
| 2023 | $1,020 | $62,854 | $8,624 | $54,230 |
| 2022 | $878 | $52,222 | $7,084 | $45,138 |
| 2021 | $1,529 | $48,301 | $7,084 | $41,217 |
| 2020 | $1,484 | $45,068 | $5,390 | $39,678 |
| 2019 | $1,442 | $43,399 | $5,390 | $38,009 |
| 2018 | $1,361 | $38,760 | $5,390 | $33,370 |
| 2017 | $1,348 | $37,994 | $5,390 | $32,604 |
| 2016 | $1,345 | $37,616 | $5,360 | $32,256 |
| 2015 | -- | $41,586 | $5,360 | $36,226 |
| 2014 | -- | $41,586 | $5,360 | $36,226 |
Source: Public Records
Map
Nearby Homes
- 415 E 10th St SE
- 211 E 11th St SE
- 9 Eastridge Ct SW
- 1 Vassar Dr SE
- 31 Notasulga Dr SW
- 0 Turnbull Dr SE Unit 10570009
- 311 Roswell Ave SE
- 801 Maple Ave SW
- 13 Townview Rd SE
- 1314 E 2nd Ave SE
- 2 Fair St SW
- 12 Turnbull Dr SE
- 162 E 11th St SE
- 170 E 11th St SW
- 2 Coral Ave SW
- 168 E 11th St SE
- 702 River Ave SW
- 164 E 11th St SE
- 166 E 11th St SW
- 0 Kentucky Ave SE Unit 7619166
- 408 E 8th St SE
- 410 E 8th St SE
- 12 Kentucky Ave SE
- 5 Kentucky Ave SE
- 9 Kentucky Ave SE
- 406 E 8th St SE
- 11 Kentucky Ave SE
- 404 E 8th St SE
- 400 & 402 E 8th St SE
- 402 E 8th St SE
- 420 E 8th St SE
- 4 Porter St SW Unit LA
- 4 Laporte St SE
- 321 Laporte St SE
- 804 Highland Ave SE
- 425 E 8th St SE
- 800 Highland Ave SE
- 802 Highland Ave SE
- 6 Laporte St SE