
Seller's Agent in 2026
Steve Graczyk
J. Barrett & Company
(978) 922-3683
43 in this area
84 Total Sales


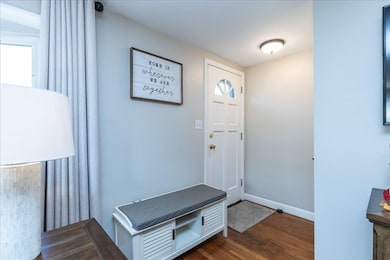
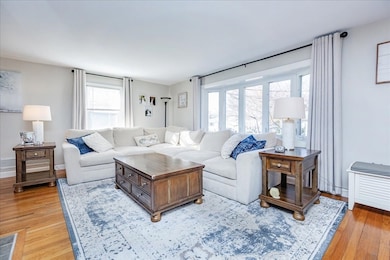
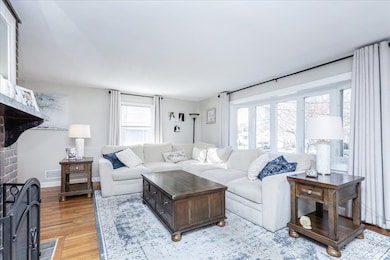
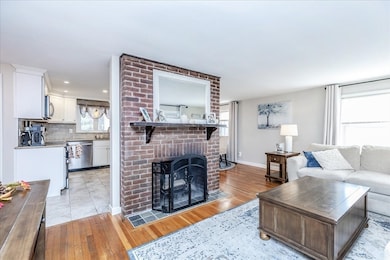
Welcome to your new home in the heart of Danvers! This beautifully maintained Ranch offers convenient one-level living and is centrally located near downtown shops, restaurants, schools, parks, the YMCA, malls, and major highways. The updated kitchen features stainless steel appliances and a bright dining area overlooking a sun-drenched living room with a cozy fireplace. The main level includes a guest bedroom, full bath, and a spacious primary suite with sky light ceilings, generous closet space, and slider access to a private backyard retreat. Enjoy year-round comfort in the inviting four-season room with its own fireplace and views of the serene, fenced in yard—perfect for relaxing or entertaining. The lower level offers two versatile rooms, ideal for additional bedrooms, office, or hobby space. With its charm, flexible layout, and unbeatable location, this Danvers gem is ready for you to call “HOME”...Priced aggressively at $356 per sq foot this home will not last.
| Date | Type | Sale Price | Title Company |
|---|---|---|---|
| Quit Claim Deed | $747,500 | -- | |
| Deed | $365,000 | -- | |
| Deed | $450,000 | -- | |
| Deed | $450,000 | -- |
| Date | Status | Loan Amount | Loan Type |
|---|---|---|---|
| Open | $635,000 | New Conventional | |
| Previous Owner | $262,500 | No Value Available | |
| Previous Owner | $15,000 | Unknown |
| Date | Event | Price | List to Sale | Price per Sq Ft |
|---|---|---|---|---|
| 01/29/2026 01/29/26 | Sold | $747,500 | -1.6% | $350 / Sq Ft |
| 01/01/2026 01/01/26 | Pending | -- | -- | -- |
| 11/17/2025 11/17/25 | For Sale | $759,999 | -- | $356 / Sq Ft |
| Year | Tax Paid | Tax Assessment Tax Assessment Total Assessment is a certain percentage of the fair market value that is determined by local assessors to be the total taxable value of land and additions on the property. | Land | Improvement |
|---|---|---|---|---|
| 2025 | $7,031 | $639,800 | $342,300 | $297,500 |
| 2024 | $6,940 | $624,700 | $342,300 | $282,400 |
| 2023 | $6,660 | $566,800 | $311,100 | $255,700 |
| 2022 | $6,522 | $515,200 | $282,300 | $232,900 |
| 2021 | $6,201 | $464,500 | $267,400 | $197,100 |
| 2020 | $6,026 | $461,400 | $264,300 | $197,100 |
| 2019 | $5,795 | $436,400 | $240,300 | $196,100 |
| 2018 | $5,600 | $413,600 | $237,900 | $175,700 |
| 2017 | $5,408 | $381,100 | $207,900 | $173,200 |
| 2016 | $5,160 | $363,400 | $198,300 | $165,100 |
| 2015 | $4,908 | $329,200 | $180,300 | $148,900 |
Seller's Agent in 2026
Steve Graczyk
J. Barrett & Company
(978) 922-3683
43 in this area
84 Total Sales
Buyer's Agent in 2026
Jim Armstrong
Aluxety
(978) 394-6736
6 in this area
66 Total Sales
Source: MLS Property Information Network (MLS PIN)
MLS Number: 73455255
APN: DANV-000042-000000-000141
Disclaimer: Certain information contained herein is derived from information provided by parties other than Homes.com. All information provided is deemed reliable, but is not guaranteed to be accurate and should be independently verified.
![]() The property listing data and information, or the Images, set forth herein were provided to MLS Property Information Network, Inc. from third party sources, including sellers, lessors and public records, and were compiled by MLS Property Information Network, Inc. The property listing data and information, and the Images, are for the personal, non-commercial use of consumers having a good faith interest in purchasing or leasing listed properties of the type displayed to them and may not be used for any purpose other than to identify prospective properties which such consumers may have a good faith interest in purchasing or leasing. MLS Property Information Network, Inc. and its subscribers disclaim any and all representations and warranties as to the accuracy of the property listing data and information, or as to the accuracy of any of the Images, set forth herein.
The property listing data and information, or the Images, set forth herein were provided to MLS Property Information Network, Inc. from third party sources, including sellers, lessors and public records, and were compiled by MLS Property Information Network, Inc. The property listing data and information, and the Images, are for the personal, non-commercial use of consumers having a good faith interest in purchasing or leasing listed properties of the type displayed to them and may not be used for any purpose other than to identify prospective properties which such consumers may have a good faith interest in purchasing or leasing. MLS Property Information Network, Inc. and its subscribers disclaim any and all representations and warranties as to the accuracy of the property listing data and information, or as to the accuracy of any of the Images, set forth herein.
Ask me questions while you tour the home.