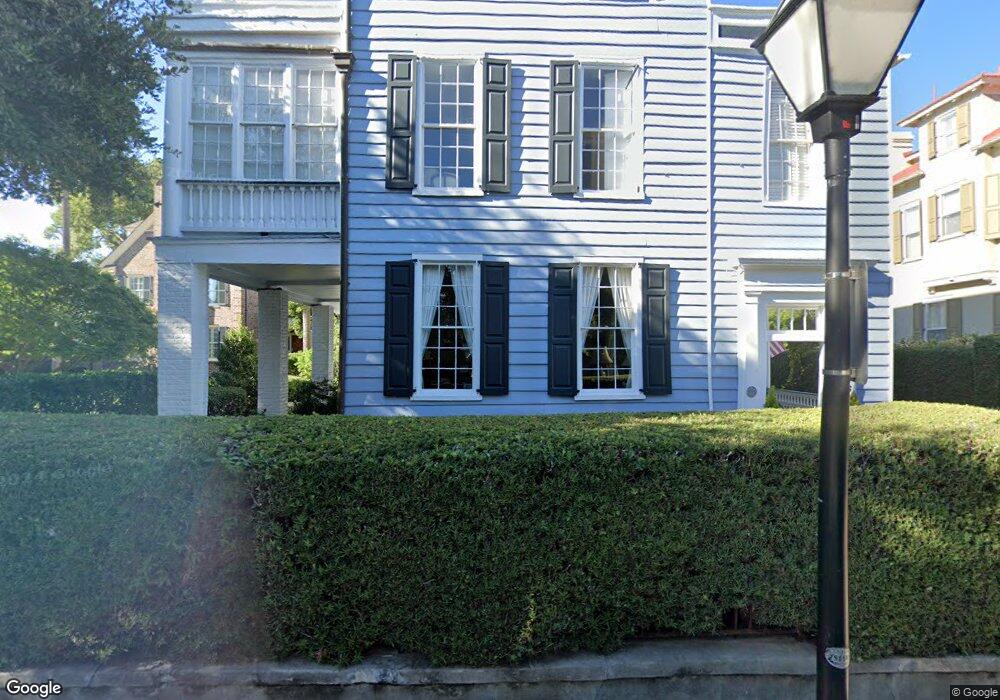
6 Lamboll St Unit 1/2 Charleston, SC 29401
South of Broad NeighborhoodEstimated Value: $3,543,000 - $4,522,000
2
Beds
4
Baths
2,965
Sq Ft
$1,331/Sq Ft
Est. Value
About This Home
This home is located at 6 Lamboll St Unit 1/2, Charleston, SC 29401 and is currently estimated at $3,945,250, approximately $1,330 per square foot. 6 Lamboll St Unit 1/2 is a home located in Charleston County with nearby schools including Memminger Elementary School, Simmons Pinckney Middle, and Burke High School.
Ownership History
Date
Name
Owned For
Owner Type
Purchase Details
Closed on
Oct 9, 2012
Sold by
Hud Ann Woodcock
Bought by
Ryan Dennis N and Ryan Diana P
Current Estimated Value
Home Financials for this Owner
Home Financials are based on the most recent Mortgage that was taken out on this home.
Original Mortgage
$945,000
Outstanding Balance
$163,975
Interest Rate
3.64%
Mortgage Type
New Conventional
Estimated Equity
$3,781,275
Purchase Details
Closed on
Jun 28, 2001
Sold by
Diversified Asset Management Ii Lp
Bought by
Hurd Ann Woodcock and Lamboll Trust
Create a Home Valuation Report for This Property
The Home Valuation Report is an in-depth analysis detailing your home's value as well as a comparison with similar homes in the area
Home Values in the Area
Average Home Value in this Area
Purchase History
| Date | Buyer | Sale Price | Title Company |
|---|---|---|---|
| Ryan Dennis N | $1,350,000 | -- | |
| Hurd Ann Woodcock | $860,000 | -- |
Source: Public Records
Mortgage History
| Date | Status | Borrower | Loan Amount |
|---|---|---|---|
| Open | Ryan Dennis N | $945,000 |
Source: Public Records
Tax History Compared to Growth
Tax History
| Year | Tax Paid | Tax Assessment Tax Assessment Total Assessment is a certain percentage of the fair market value that is determined by local assessors to be the total taxable value of land and additions on the property. | Land | Improvement |
|---|---|---|---|---|
| 2024 | $8,702 | $69,300 | $0 | $0 |
| 2023 | $8,702 | $71,300 | $0 | $0 |
| 2022 | $8,452 | $71,300 | $0 | $0 |
| 2021 | $8,880 | $71,300 | $0 | $0 |
| 2020 | $9,218 | $71,300 | $0 | $0 |
| 2019 | $8,168 | $62,000 | $0 | $0 |
| 2017 | $31,495 | $62,000 | $0 | $0 |
| 2016 | $7,533 | $62,000 | $0 | $0 |
| 2015 | $7,796 | $62,000 | $0 | $0 |
| 2014 | $19,193 | $0 | $0 | $0 |
| 2011 | -- | $0 | $0 | $0 |
Source: Public Records
Map
Nearby Homes