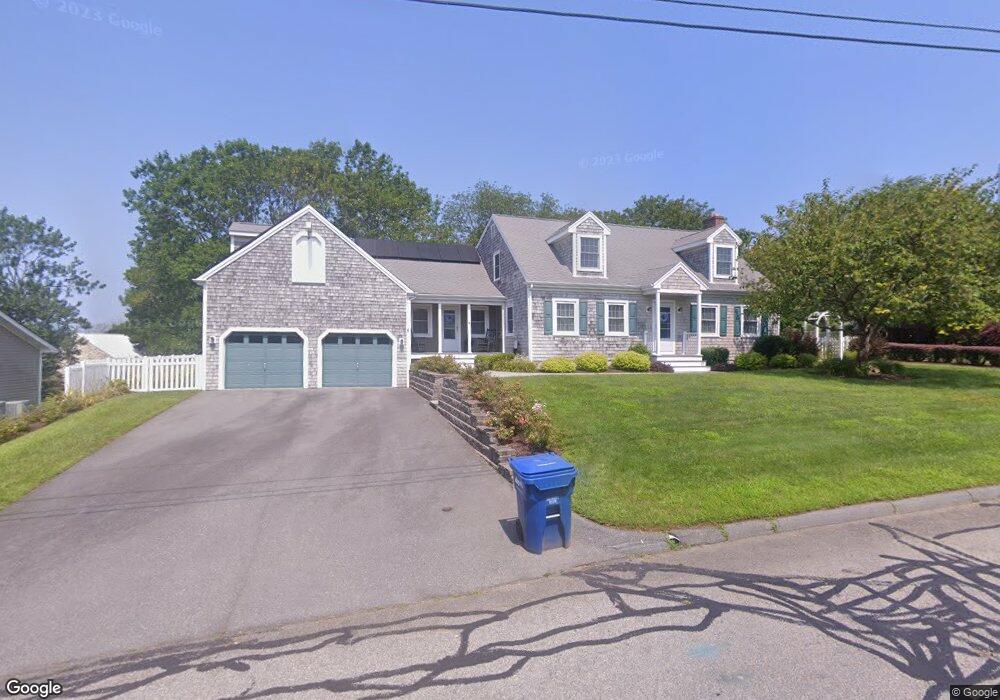
6 Laura Ln Fairhaven, MA 02719
Oxford NeighborhoodEstimated Value: $663,000 - $757,000
3
Beds
2
Baths
2,718
Sq Ft
$265/Sq Ft
Est. Value
About This Home
This home is located at 6 Laura Ln, Fairhaven, MA 02719 and is currently estimated at $720,947, approximately $265 per square foot. 6 Laura Ln is a home located in Bristol County with nearby schools including Fairhaven High School, Alma Del Mar Charter School, and St. Joseph School.
Ownership History
Date
Name
Owned For
Owner Type
Purchase Details
Closed on
Dec 6, 2022
Sold by
Balthazar Kenneth F and Balthazar Sandra L
Bought by
Balthazar Lt
Current Estimated Value
Purchase Details
Closed on
Apr 26, 1993
Sold by
Gonzales Ruth Anne
Bought by
Balthazar Kenneth F and Balthazar Sandra L
Create a Home Valuation Report for This Property
The Home Valuation Report is an in-depth analysis detailing your home's value as well as a comparison with similar homes in the area
Home Values in the Area
Average Home Value in this Area
Purchase History
| Date | Buyer | Sale Price | Title Company |
|---|---|---|---|
| Balthazar Lt | -- | None Available | |
| Balthazar Kenneth F | $2,000 | -- |
Source: Public Records
Mortgage History
| Date | Status | Borrower | Loan Amount |
|---|---|---|---|
| Previous Owner | Balthazar Kenneth F | $53,000 | |
| Previous Owner | Balthazar Kenneth F | $50,000 | |
| Previous Owner | Balthazar Kenneth F | $100,000 |
Source: Public Records
Tax History Compared to Growth
Tax History
| Year | Tax Paid | Tax Assessment Tax Assessment Total Assessment is a certain percentage of the fair market value that is determined by local assessors to be the total taxable value of land and additions on the property. | Land | Improvement |
|---|---|---|---|---|
| 2025 | $52 | $561,400 | $191,300 | $370,100 |
| 2024 | $4,965 | $537,900 | $191,300 | $346,600 |
| 2023 | $4,697 | $472,100 | $177,400 | $294,700 |
| 2022 | $4,605 | $450,600 | $169,100 | $281,500 |
| 2021 | $4,611 | $408,400 | $153,800 | $254,600 |
| 2020 | $4,441 | $401,500 | $146,900 | $254,600 |
| 2019 | $4,410 | $377,900 | $133,800 | $244,100 |
| 2018 | $4,268 | $363,200 | $127,500 | $235,700 |
| 2017 | $4,267 | $354,400 | $127,500 | $226,900 |
| 2016 | $4,252 | $349,100 | $127,500 | $221,600 |
| 2015 | $4,046 | $333,000 | $127,500 | $205,500 |
Source: Public Records
Map
Nearby Homes