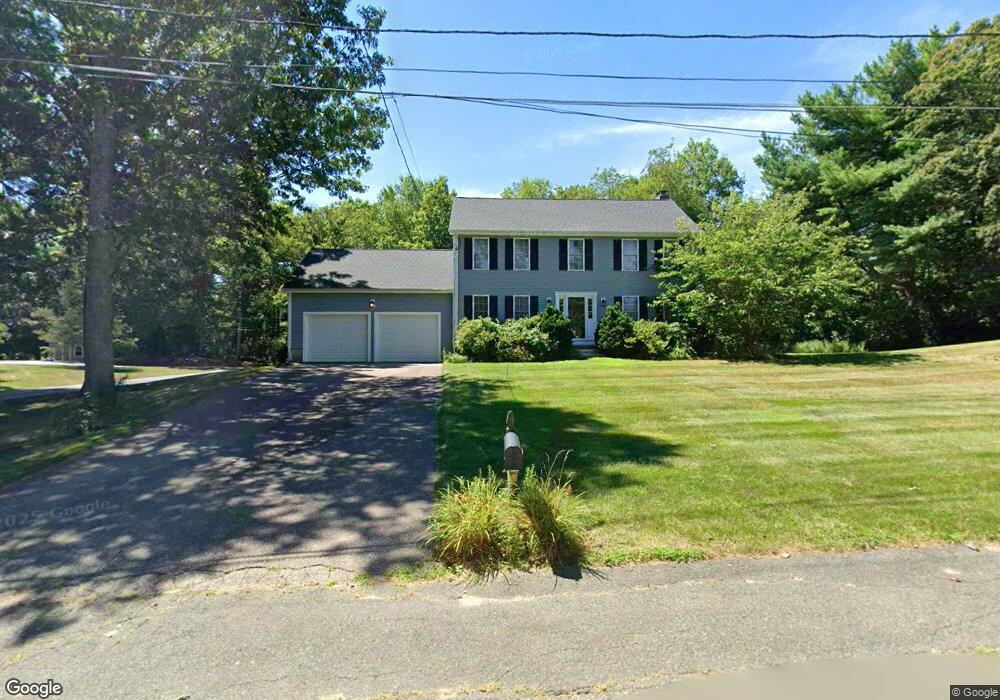
6 Lealand Peck Dr Wrentham, MA 02093
Estimated Value: $719,000 - $864,000
4
Beds
2
Baths
1,753
Sq Ft
$443/Sq Ft
Est. Value
About This Home
This home is located at 6 Lealand Peck Dr, Wrentham, MA 02093 and is currently estimated at $776,565, approximately $442 per square foot. 6 Lealand Peck Dr is a home located in Norfolk County with nearby schools including Delaney Elementary School, Charles E Roderick, and Mercymount Country Day School.
Ownership History
Date
Name
Owned For
Owner Type
Purchase Details
Closed on
Jan 31, 1997
Sold by
Diplacido Dev Corp
Bought by
Malatesta Marc A and Malatesta Karen E
Current Estimated Value
Home Financials for this Owner
Home Financials are based on the most recent Mortgage that was taken out on this home.
Original Mortgage
$159,600
Interest Rate
7.65%
Mortgage Type
Purchase Money Mortgage
Purchase Details
Closed on
Oct 30, 1996
Sold by
Paris Adm Ellyn
Bought by
Diplacido Dev Corp
Home Financials for this Owner
Home Financials are based on the most recent Mortgage that was taken out on this home.
Original Mortgage
$149,925
Interest Rate
8.07%
Mortgage Type
Purchase Money Mortgage
Create a Home Valuation Report for This Property
The Home Valuation Report is an in-depth analysis detailing your home's value as well as a comparison with similar homes in the area
Home Values in the Area
Average Home Value in this Area
Purchase History
| Date | Buyer | Sale Price | Title Company |
|---|---|---|---|
| Malatesta Marc A | $199,500 | -- | |
| Diplacido Dev Corp | $160,000 | -- |
Source: Public Records
Mortgage History
| Date | Status | Borrower | Loan Amount |
|---|---|---|---|
| Open | Diplacido Dev Corp | $147,959 | |
| Closed | Diplacido Dev Corp | $159,600 | |
| Previous Owner | Diplacido Dev Corp | $149,925 |
Source: Public Records
Tax History Compared to Growth
Tax History
| Year | Tax Paid | Tax Assessment Tax Assessment Total Assessment is a certain percentage of the fair market value that is determined by local assessors to be the total taxable value of land and additions on the property. | Land | Improvement |
|---|---|---|---|---|
| 2025 | $7,427 | $640,800 | $302,100 | $338,700 |
| 2024 | $7,261 | $605,100 | $302,100 | $303,000 |
| 2023 | $6,850 | $542,800 | $274,500 | $268,300 |
| 2022 | $6,711 | $490,900 | $256,000 | $234,900 |
| 2021 | $6,187 | $439,700 | $223,400 | $216,300 |
| 2020 | $6,147 | $431,400 | $198,600 | $232,800 |
| 2019 | $5,942 | $420,800 | $198,600 | $222,200 |
| 2018 | $5,687 | $399,400 | $198,900 | $200,500 |
| 2017 | $5,559 | $390,100 | $195,000 | $195,100 |
| 2016 | $5,469 | $383,000 | $189,400 | $193,600 |
| 2015 | $5,375 | $358,800 | $182,100 | $176,700 |
| 2014 | $5,316 | $347,200 | $175,100 | $172,100 |
Source: Public Records
Map
Nearby Homes
- 791 South St Unit 5
- 50 Green St
- 1204 South St
- 1222 South St
- 80 Carriage House Ln
- 440 Chestnut St
- Lot 1 - Blueberry 2 Car Plan at King Philip Estates
- Lot 8 - Blueberry 2 Car Plan at King Philip Estates
- Lot 5 - Hughes 2 car Plan at King Philip Estates
- Lot 6 - Blueberry 3 Car Plan at King Philip Estates
- Lot 2 - Camden 2 Car Plan at King Philip Estates
- Lot 7 - Cedar Plan at King Philip Estates
- Lot 4 - Hemingway 2 Car Plan at King Philip Estates
- Lot 3 - Blueberry 2 Car Plan at King Philip Estates
- Lot 3 - 14 Earle Stewart Ln
- 11 Earle Stewart Ln
- 4 Munroe Dr
- 19 Chestnut Lot 0
- 131 Creek St Unit 7
- 12 Grant St