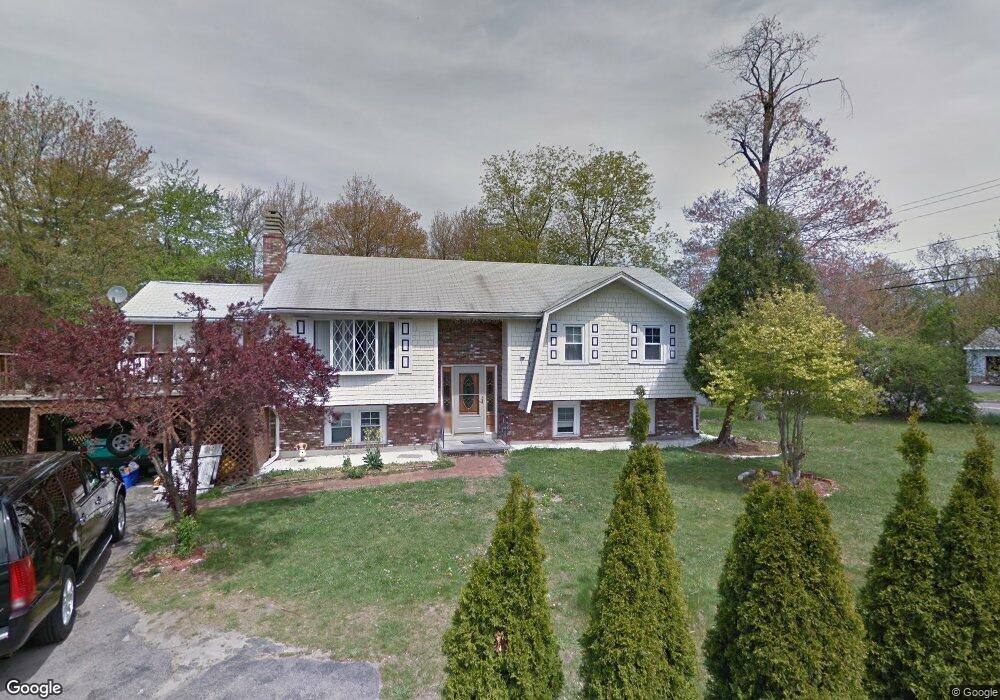
6 Lebreque Way Randolph, MA 02368
North Randolph NeighborhoodEstimated Value: $516,110 - $539,000
3
Beds
1
Bath
884
Sq Ft
$593/Sq Ft
Est. Value
About This Home
This home is located at 6 Lebreque Way, Randolph, MA 02368 and is currently estimated at $524,028, approximately $592 per square foot. 6 Lebreque Way is a home located in Norfolk County with nearby schools including Randolph High School and Lighthouse Baptist Christian Academy.
Ownership History
Date
Name
Owned For
Owner Type
Purchase Details
Closed on
Nov 23, 1993
Sold by
Adams Donald B and Adams Donald E
Bought by
Landford Gwendolyn
Current Estimated Value
Home Financials for this Owner
Home Financials are based on the most recent Mortgage that was taken out on this home.
Original Mortgage
$95,120
Interest Rate
6.77%
Mortgage Type
Purchase Money Mortgage
Create a Home Valuation Report for This Property
The Home Valuation Report is an in-depth analysis detailing your home's value as well as a comparison with similar homes in the area
Home Values in the Area
Average Home Value in this Area
Purchase History
| Date | Buyer | Sale Price | Title Company |
|---|---|---|---|
| Landford Gwendolyn | $118,900 | -- |
Source: Public Records
Mortgage History
| Date | Status | Borrower | Loan Amount |
|---|---|---|---|
| Open | Landford Gwendolyn | $115,000 | |
| Closed | Landford Gwendolyn | $95,120 |
Source: Public Records
Tax History Compared to Growth
Tax History
| Year | Tax Paid | Tax Assessment Tax Assessment Total Assessment is a certain percentage of the fair market value that is determined by local assessors to be the total taxable value of land and additions on the property. | Land | Improvement |
|---|---|---|---|---|
| 2025 | $5,649 | $486,600 | $253,300 | $233,300 |
| 2024 | $5,514 | $481,600 | $248,300 | $233,300 |
| 2023 | $5,163 | $427,400 | $225,700 | $201,700 |
| 2022 | $5,027 | $369,600 | $188,200 | $181,400 |
| 2021 | $4,945 | $334,600 | $156,800 | $177,800 |
| 2020 | $4,947 | $331,800 | $156,800 | $175,000 |
| 2019 | $4,734 | $316,000 | $149,300 | $166,700 |
| 2018 | $4,384 | $276,100 | $135,700 | $140,400 |
| 2017 | $4,168 | $257,600 | $129,200 | $128,400 |
| 2016 | $4,083 | $234,800 | $117,500 | $117,300 |
| 2015 | $4,096 | $226,300 | $112,000 | $114,300 |
Source: Public Records
Map
Nearby Homes
- 229 Chestnut St
- 2 Smith Rd
- 12 Webster St
- 7 Webster St
- 33 Michael Rd
- 16 Simmonds Blvd Unit 16
- 20 Simmonds Blvd Unit 20
- 14 Simmonds Blvd Unit 14
- 12 Simmonds Blvd Unit 12
- 34 Orchard St
- 10 Michael Rd
- 11 Royal Crest Dr Unit 5
- 9 Royal Crest Dr Unit 12
- 304 High St
- 43 Emily Jeffers Rd
- 26 Knights Crescent St
- 1 Clark Cir
- 591 N Main St
- 79 Gold St
- 23 Emeline St
- 163 Chestnut St
- 167 Chestnut St
- 107 Chestnut St
- 5 Ferry Rd
- 175 Chestnut St
- 99 Chestnut St
- 101 Chestnut St
- 99 Chestnut St Unit 99
- 99 Chestnut St Unit Rosemont Sq
- 44 Marion St
- 170 Chestnut St
- 168 Chestnut St
- 8 Haddad Ave
- 166 Chestnut St
- 172 Chestnut St
- 95 Chestnut St
- 5 Lambert Rd
- 179 Chestnut St
- 174 Chestnut St
- 9 Lambert Rd