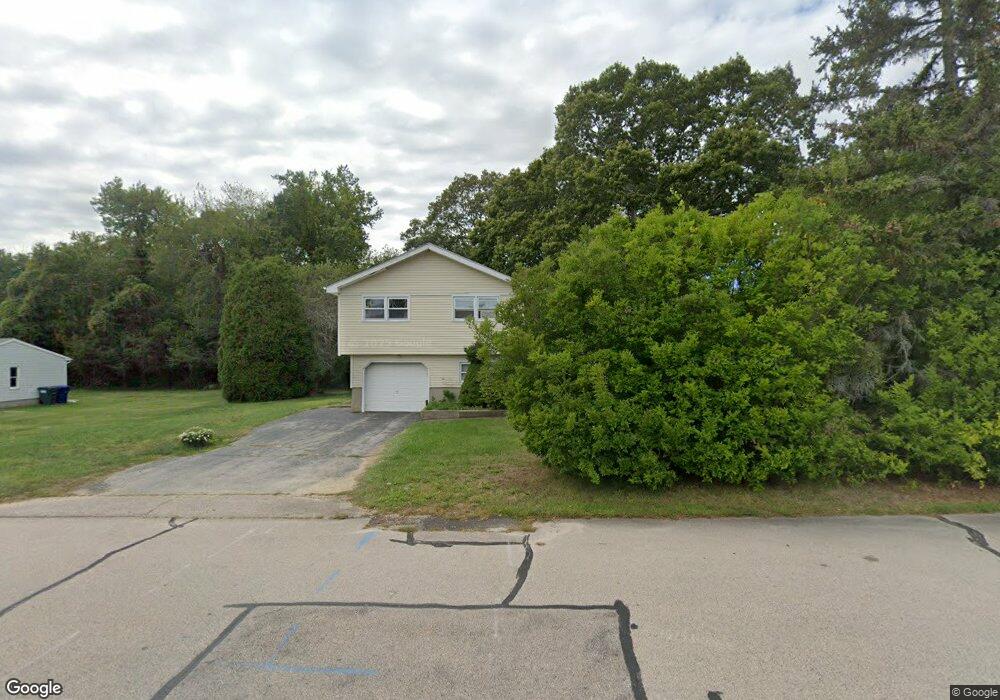
6 Lee St Westerly, RI 02891
Estimated Value: $468,974 - $552,000
3
Beds
2
Baths
1,533
Sq Ft
$346/Sq Ft
Est. Value
About This Home
This home is located at 6 Lee St, Westerly, RI 02891 and is currently estimated at $530,244, approximately $345 per square foot. 6 Lee St is a home located in Washington County with nearby schools including Westerly High School and St. Michael School.
Ownership History
Date
Name
Owned For
Owner Type
Purchase Details
Closed on
May 26, 2004
Sold by
Zeng Brien Bai Ru
Bought by
Read David
Current Estimated Value
Home Financials for this Owner
Home Financials are based on the most recent Mortgage that was taken out on this home.
Original Mortgage
$145,000
Interest Rate
5.88%
Mortgage Type
Purchase Money Mortgage
Create a Home Valuation Report for This Property
The Home Valuation Report is an in-depth analysis detailing your home's value as well as a comparison with similar homes in the area
Home Values in the Area
Average Home Value in this Area
Purchase History
| Date | Buyer | Sale Price | Title Company |
|---|---|---|---|
| Read David | $245,000 | -- |
Source: Public Records
Mortgage History
| Date | Status | Borrower | Loan Amount |
|---|---|---|---|
| Open | Read David | $133,500 | |
| Closed | Read David | $145,000 | |
| Previous Owner | Read David | $40,000 |
Source: Public Records
Tax History
| Year | Tax Paid | Tax Assessment Tax Assessment Total Assessment is a certain percentage of the fair market value that is determined by local assessors to be the total taxable value of land and additions on the property. | Land | Improvement |
|---|---|---|---|---|
| 2025 | $3,221 | $414,000 | $174,000 | $240,000 |
| 2024 | $3,128 | $299,300 | $124,600 | $174,700 |
| 2023 | $3,041 | $299,300 | $124,600 | $174,700 |
| 2022 | $3,023 | $299,300 | $124,600 | $174,700 |
| 2021 | $2,864 | $237,500 | $108,500 | $129,000 |
| 2020 | $2,814 | $237,500 | $108,500 | $129,000 |
| 2019 | $2,788 | $237,500 | $108,500 | $129,000 |
| 2018 | $2,697 | $218,400 | $108,500 | $109,900 |
| 2017 | $2,621 | $218,400 | $108,500 | $109,900 |
| 2016 | $2,621 | $218,400 | $108,500 | $109,900 |
| 2015 | $2,478 | $220,700 | $110,800 | $109,900 |
| 2014 | $2,439 | $220,700 | $110,800 | $109,900 |
Source: Public Records
Map
Nearby Homes
- 12 Apache Dr Unit A
- 17 Apache Dr Unit G
- 22 Colonial Dr
- 19 Apache Dr Unit F
- 19 Apache Dr Unit 19C
- 0 Iroquois Ave
- 2 Marichris Dr
- 52 Bellevue Ave
- 14 George St
- 33 Whipple Ave
- 16 Spring St
- 12 Batterson Ave
- 21 North Dr
- 25 School St Unit 2
- 5 Marion St
- 6 Wilder Ave
- 19 Crestview Dr Unit C
- 23 Abbey Ln Unit 12
- 24 Abbey Ln Unit 13
- 7 Dixon St
Your Personal Tour Guide
Ask me questions while you tour the home.