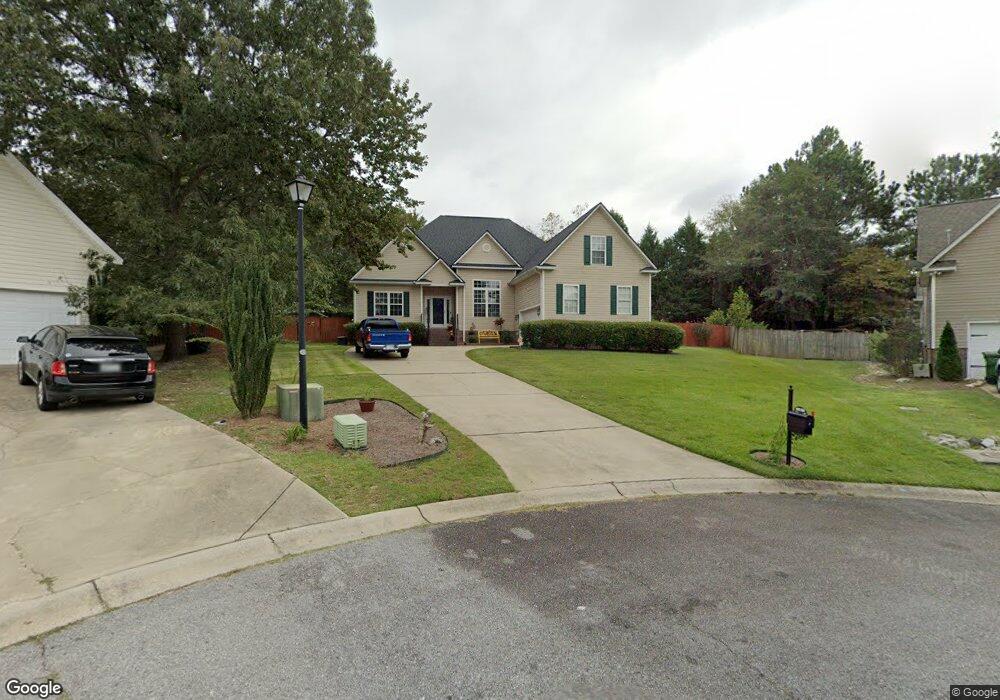
6 Legacy Ct Elgin, SC 29045
Northeast Columbia NeighborhoodEstimated Value: $315,080 - $325,000
3
Beds
2
Baths
2,246
Sq Ft
$142/Sq Ft
Est. Value
About This Home
This home is located at 6 Legacy Ct, Elgin, SC 29045 and is currently estimated at $318,520, approximately $141 per square foot. 6 Legacy Ct is a home located in Richland County with nearby schools including Bookman Road Elementary School, Summit Parkway Middle School, and Spring Valley High School.
Ownership History
Date
Name
Owned For
Owner Type
Purchase Details
Closed on
Mar 22, 2016
Sold by
Renken Otmar and Renken Flora E
Bought by
Renken Otmar and Renken Flora E
Current Estimated Value
Purchase Details
Closed on
Nov 5, 2014
Sold by
Farland Kenneth A
Bought by
Renken Otmar and Renken Flora E
Purchase Details
Closed on
Mar 11, 2003
Sold by
Delk Construction Inc
Bought by
Farland Kenneth A
Home Financials for this Owner
Home Financials are based on the most recent Mortgage that was taken out on this home.
Original Mortgage
$145,000
Interest Rate
5.88%
Purchase Details
Closed on
Nov 11, 2002
Sold by
South Capital Group Inc
Bought by
Delk Construction Inc
Home Financials for this Owner
Home Financials are based on the most recent Mortgage that was taken out on this home.
Original Mortgage
$299,300
Interest Rate
5.98%
Create a Home Valuation Report for This Property
The Home Valuation Report is an in-depth analysis detailing your home's value as well as a comparison with similar homes in the area
Home Values in the Area
Average Home Value in this Area
Purchase History
| Date | Buyer | Sale Price | Title Company |
|---|---|---|---|
| Renken Otmar | -- | None Available | |
| Renken Otmar | $74,038 | -- | |
| Farland Kenneth A | $202,525 | -- | |
| Delk Construction Inc | $47,000 | -- |
Source: Public Records
Mortgage History
| Date | Status | Borrower | Loan Amount |
|---|---|---|---|
| Previous Owner | Farland Kenneth A | $145,000 | |
| Previous Owner | Delk Construction Inc | $299,300 |
Source: Public Records
Tax History
| Year | Tax Paid | Tax Assessment Tax Assessment Total Assessment is a certain percentage of the fair market value that is determined by local assessors to be the total taxable value of land and additions on the property. | Land | Improvement |
|---|---|---|---|---|
| 2024 | $1,954 | $239,100 | $0 | $0 |
| 2023 | $1,887 | $8,316 | $0 | $0 |
| 2022 | $1,643 | $207,900 | $36,000 | $171,900 |
| 2021 | $1,647 | $8,320 | $0 | $0 |
| 2020 | $1,671 | $8,320 | $0 | $0 |
| 2019 | $1,648 | $8,320 | $0 | $0 |
| 2018 | $1,414 | $7,250 | $0 | $0 |
| 2017 | $1,342 | $7,040 | $0 | $0 |
| 2016 | $1,769 | $7,040 | $0 | $0 |
| 2015 | $1,767 | $7,000 | $0 | $0 |
| 2014 | -- | $175,300 | $0 | $0 |
| 2013 | -- | $7,010 | $0 | $0 |
Source: Public Records
Map
Nearby Homes
- 14 Turtle Creek Way
- 575 Silver Spoon Ln
- 15 Turtle Creek Way
- 516 Silver Spoon Ln
- 212 Briarcliffe E
- 517 Silver Spoon Ln
- 537 Park Place Dr
- 438 Grand National Ln
- 126 Cattle Baron Ln
- 116 Windwood Dr
- 109 Branch Hill Dr
- 447 Easy Goer Ct
- 221 Hickory Hill Trail
- 76 Crusader Ct
- 5 Briarcliffe Ct W
- 116 Belle Oaks Dr
- 18 Belle Oaks Ct
- 104 Steeple Dr
- 323 Hillridge Way
- 925 Northern Dancer Ln
- 7 Legacy Ct
- 311 Plantation Pointe Dr
- 309 Plantation Pointe Dr
- 313 Plantation Pointe Dr
- 3 Legacy Ct
- 5 Legacy Ct
- 3 Spanish Moss Ct
- 315 Plantation Pointe Dr
- 501 Plantation Pointe Dr
- 503 Plantation Pointe Dr
- 7 Spanish Moss Ct
- 505 Plantation Pointe Dr
- 431 Plantation Pointe Dr
- 401 Plantation Pointe Dr
- 1 Legacy Ct
- 507 Plantation Pointe Dr
- 305 Plantation Pointe Dr
- 307 Plantation Pointe Dr
- 429 Plantation Pointe Dr
- 403 Plantation Pointe Dr
Your Personal Tour Guide
Ask me questions while you tour the home.