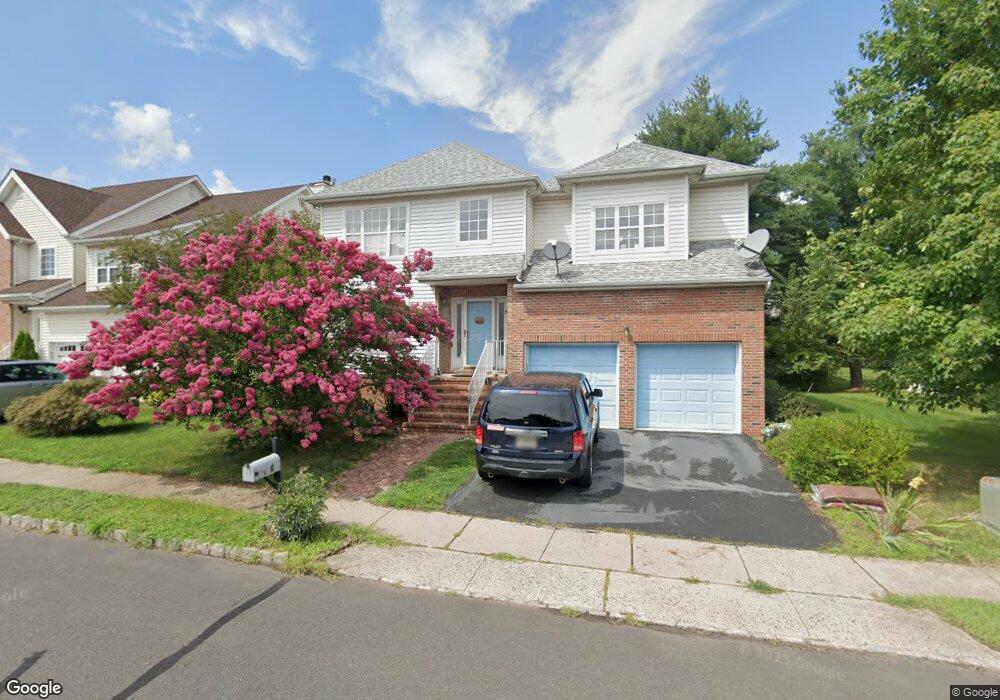
6 Leigh Rd Hillsborough, NJ 08844
Estimated Value: $720,272 - $811,000
--
Bed
--
Bath
2,364
Sq Ft
$326/Sq Ft
Est. Value
About This Home
This home is located at 6 Leigh Rd, Hillsborough, NJ 08844 and is currently estimated at $770,818, approximately $326 per square foot. 6 Leigh Rd is a home located in Somerset County with nearby schools including Hillsborough High School.
Ownership History
Date
Name
Owned For
Owner Type
Purchase Details
Closed on
Sep 23, 2005
Sold by
Irfanullah Arif
Bought by
Lin Yen Chuan and Kuo Nai Ching
Current Estimated Value
Home Financials for this Owner
Home Financials are based on the most recent Mortgage that was taken out on this home.
Original Mortgage
$310,000
Outstanding Balance
$165,747
Interest Rate
5.84%
Estimated Equity
$605,071
Purchase Details
Closed on
May 24, 2000
Sold by
Devt Courtland
Bought by
Irfanullah Arif
Home Financials for this Owner
Home Financials are based on the most recent Mortgage that was taken out on this home.
Original Mortgage
$203,000
Interest Rate
8.1%
Create a Home Valuation Report for This Property
The Home Valuation Report is an in-depth analysis detailing your home's value as well as a comparison with similar homes in the area
Home Values in the Area
Average Home Value in this Area
Purchase History
| Date | Buyer | Sale Price | Title Company |
|---|---|---|---|
| Lin Yen Chuan | $530,000 | -- | |
| Irfanullah Arif | $259,900 | -- |
Source: Public Records
Mortgage History
| Date | Status | Borrower | Loan Amount |
|---|---|---|---|
| Open | Lin Yen Chuan | $310,000 | |
| Previous Owner | Irfanullah Arif | $203,000 |
Source: Public Records
Tax History Compared to Growth
Tax History
| Year | Tax Paid | Tax Assessment Tax Assessment Total Assessment is a certain percentage of the fair market value that is determined by local assessors to be the total taxable value of land and additions on the property. | Land | Improvement |
|---|---|---|---|---|
| 2025 | $13,372 | $690,300 | $333,000 | $357,300 |
| 2024 | $13,372 | $624,000 | $333,000 | $291,000 |
| 2023 | $12,309 | $571,700 | $328,000 | $243,700 |
| 2022 | $12,239 | $548,100 | $303,000 | $245,100 |
| 2021 | $11,374 | $484,400 | $238,000 | $246,400 |
| 2020 | $11,138 | $467,200 | $223,000 | $244,200 |
| 2019 | $10,905 | $453,600 | $208,000 | $245,600 |
| 2018 | $10,883 | $449,900 | $203,000 | $246,900 |
| 2017 | $10,597 | $438,800 | $153,000 | $285,800 |
| 2016 | $10,631 | $440,400 | $153,000 | $287,400 |
| 2015 | $11,226 | $470,900 | $148,000 | $322,900 |
| 2014 | $10,043 | $430,300 | $148,000 | $282,300 |
Source: Public Records
Map
Nearby Homes