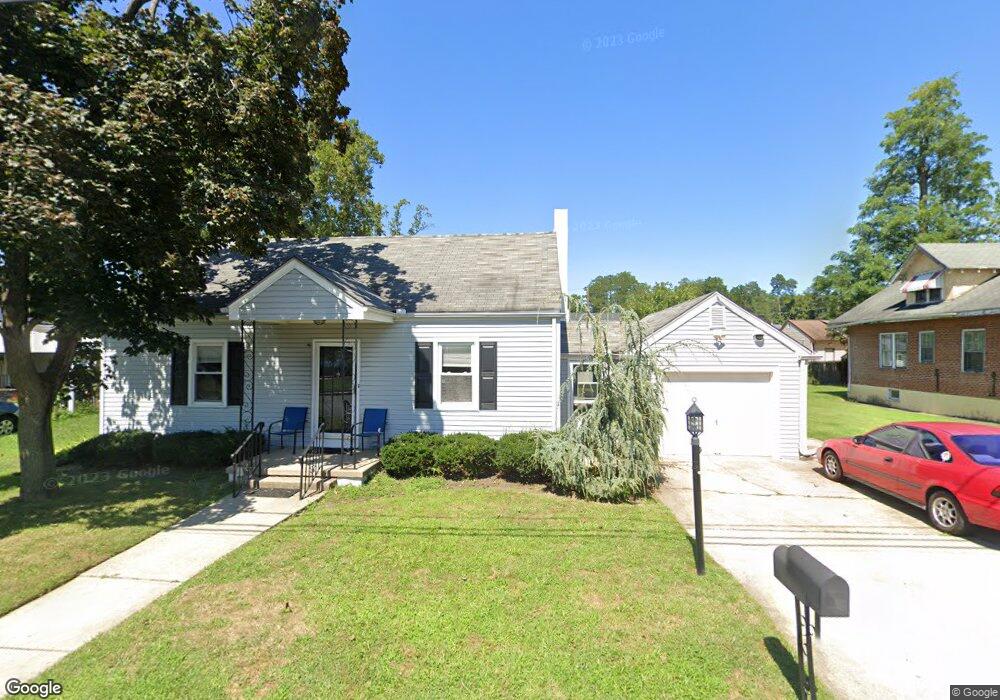
6 Liberty Ave Trenton, NJ 08620
Estimated Value: $341,385 - $427,000
--
Bed
--
Bath
1,610
Sq Ft
$235/Sq Ft
Est. Value
About This Home
This home is located at 6 Liberty Ave, Trenton, NJ 08620 and is currently estimated at $379,096, approximately $235 per square foot. 6 Liberty Ave is a home located in Burlington County with nearby schools including Bordentown Reg High School and St Raphael School.
Ownership History
Date
Name
Owned For
Owner Type
Purchase Details
Closed on
Jul 12, 2002
Sold by
Scott David and Scott Michelle
Bought by
Scott Michael
Current Estimated Value
Home Financials for this Owner
Home Financials are based on the most recent Mortgage that was taken out on this home.
Original Mortgage
$90,000
Interest Rate
6.73%
Purchase Details
Closed on
Dec 28, 1998
Sold by
Bartolone Louis
Bought by
Scott David
Home Financials for this Owner
Home Financials are based on the most recent Mortgage that was taken out on this home.
Original Mortgage
$104,500
Interest Rate
6.7%
Create a Home Valuation Report for This Property
The Home Valuation Report is an in-depth analysis detailing your home's value as well as a comparison with similar homes in the area
Home Values in the Area
Average Home Value in this Area
Purchase History
| Date | Buyer | Sale Price | Title Company |
|---|---|---|---|
| Scott Michael | $114,000 | Multiple | |
| Scott David | $110,000 | Chicago Title Insurance Co |
Source: Public Records
Mortgage History
| Date | Status | Borrower | Loan Amount |
|---|---|---|---|
| Closed | Scott Michael | $90,000 | |
| Closed | Scott David | $104,500 |
Source: Public Records
Tax History Compared to Growth
Tax History
| Year | Tax Paid | Tax Assessment Tax Assessment Total Assessment is a certain percentage of the fair market value that is determined by local assessors to be the total taxable value of land and additions on the property. | Land | Improvement |
|---|---|---|---|---|
| 2025 | $7,736 | $201,300 | $73,800 | $127,500 |
| 2024 | $7,039 | $201,300 | $73,800 | $127,500 |
| 2023 | $7,039 | $201,300 | $73,800 | $127,500 |
| 2022 | $7,029 | $201,300 | $73,800 | $127,500 |
| 2021 | $7,192 | $201,300 | $73,800 | $127,500 |
| 2020 | $7,219 | $201,300 | $73,800 | $127,500 |
| 2019 | $7,052 | $201,300 | $73,800 | $127,500 |
| 2018 | $6,945 | $201,300 | $73,800 | $127,500 |
| 2017 | $6,818 | $201,300 | $73,800 | $127,500 |
| 2016 | $6,663 | $201,300 | $73,800 | $127,500 |
| 2015 | $6,450 | $201,300 | $73,800 | $127,500 |
| 2014 | $6,154 | $201,300 | $73,800 | $127,500 |
Source: Public Records
Map
Nearby Homes