6 Lindy Ct Ballwin, MO 63021
Estimated Value: $247,000 - $382,000
About This Home
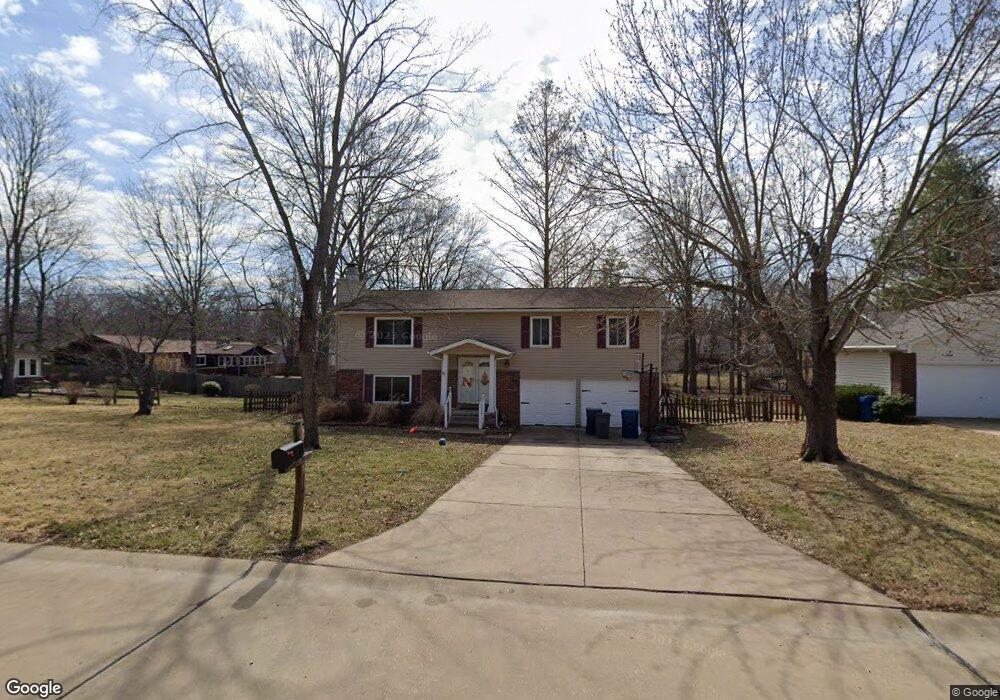
This home is located at 6 Lindy Ct, Ballwin, MO 63021 and is currently estimated at $309,581, approximately $280 per square foot. 6 Lindy Ct is a home located in St. Louis County with nearby schools including Ballwin Elementary School, Selvidge Middle School, and Marquette Sr. High School.
Ownership History
We collect this data history from publicly available records. To have your information removed, we recommend requesting removal directly through your county’s website.
Purchase Details
Home Financials for this Owner
Home Financials are based on the most recent Mortgage that was taken out on this home.Home Values in the Area
Average Home Value in this Area
Purchase History
We collect this data history from publicly available records. To have your information removed, we recommend requesting removal directly through your county’s website.
| Date | Buyer | Sale Price | Title Company |
|---|---|---|---|
| -- | Title Resources Inc |
Mortgage History
We collect this data history from publicly available records. To have your information removed, we recommend requesting removal directly through your county’s website.
| Date | Status | Borrower | Loan Amount |
|---|---|---|---|
| Closed | $172,975 |
Tax History
We collect this data history from publicly available records. To have your information removed, we recommend requesting removal directly through your county’s website.
| Year | Tax Paid | Tax Assessment Tax Assessment Total Assessment is a certain percentage of the fair market value that is determined by local assessors to be the total taxable value of land and additions on the property. | Land | Improvement |
|---|---|---|---|---|
| 2025 | $3,218 | $52,690 | $23,940 | $28,750 |
| 2024 | $3,218 | $45,870 | $19,950 | $25,920 |
| 2023 | $3,218 | $45,870 | $19,950 | $25,920 |
| 2022 | $3,109 | $41,190 | $19,950 | $21,240 |
| 2021 | $3,086 | $41,190 | $19,950 | $21,240 |
| 2020 | $2,894 | $36,800 | $16,890 | $19,910 |
| 2019 | $2,905 | $36,800 | $16,890 | $19,910 |
| 2018 | $2,831 | $33,800 | $13,280 | $20,520 |
| 2017 | $2,764 | $33,800 | $13,280 | $20,520 |
| 2016 | $2,518 | $29,580 | $9,420 | $20,160 |
| 2015 | $2,467 | $29,580 | $9,420 | $20,160 |
| 2014 | $2,222 | $25,950 | $12,290 | $13,660 |
Map
- 28 James Ct
- 457 Rosedale Terrace
- 17 Saint Lawrence Dr
- 200 Hillcrest Blvd
- 309 Wembley Ln
- 502 Wicklow Dr
- 510 Wicklow Dr
- 798 Canary Dr
- 373 Sorrento Dr
- 893 Oklahoma Ave
- 375 Novara Dr
- 407 Palermo Dr
- 0 the Indigo H @ Lock Dr
- 0 the Rainier F @ Lock Dr
- 504 Wren Ave
- 406 Palermo Dr
- 327 Tall Timber Meadows Dr
- 283 Ramsey Ln
- 159 Spring Oaks Dr
- 425 Bush Dr
Ask me questions while you tour the home.