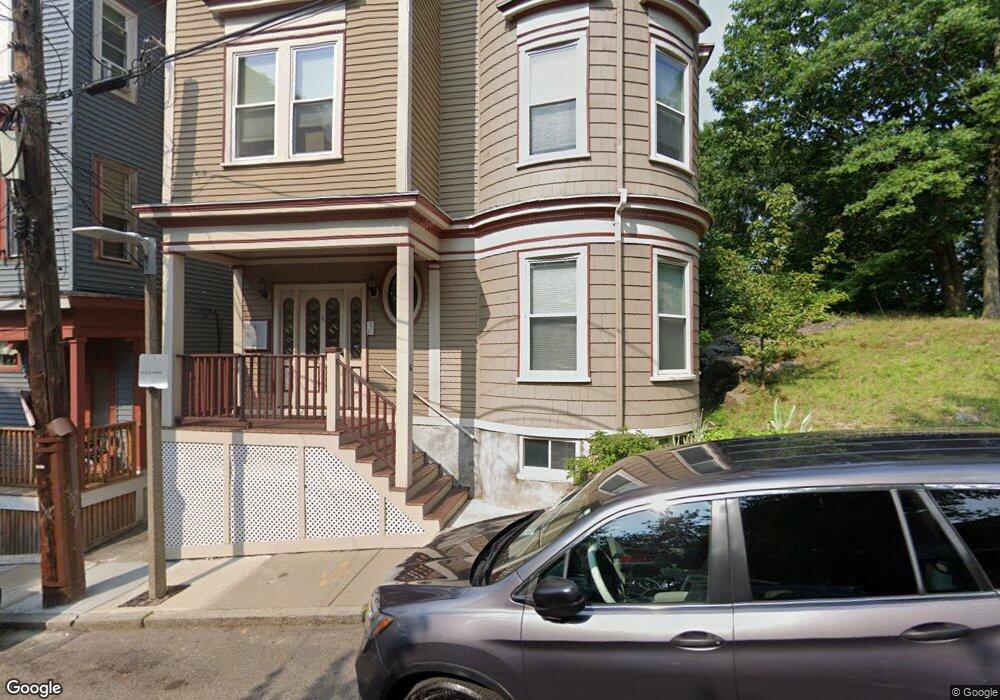
6 Logan St Unit 3 Roxbury, MA 02119
Fort Hill NeighborhoodEstimated Value: $684,809 - $894,000
3
Beds
2
Baths
2,074
Sq Ft
$362/Sq Ft
Est. Value
About This Home
This home is located at 6 Logan St Unit 3, Roxbury, MA 02119 and is currently estimated at $750,952, approximately $362 per square foot. 6 Logan St Unit 3 is a home located in Suffolk County with nearby schools including City on a Hill Charter Public School and Paige Academy.
Ownership History
Date
Name
Owned For
Owner Type
Purchase Details
Closed on
Jul 12, 2007
Sold by
Reinhold Mark C and Madigan Enda R
Bought by
Wood Randall G and Cerceillo Stephen P
Current Estimated Value
Home Financials for this Owner
Home Financials are based on the most recent Mortgage that was taken out on this home.
Original Mortgage
$269,600
Outstanding Balance
$168,333
Interest Rate
6.48%
Mortgage Type
Purchase Money Mortgage
Estimated Equity
$582,619
Create a Home Valuation Report for This Property
The Home Valuation Report is an in-depth analysis detailing your home's value as well as a comparison with similar homes in the area
Home Values in the Area
Average Home Value in this Area
Purchase History
| Date | Buyer | Sale Price | Title Company |
|---|---|---|---|
| Wood Randall G | $337,000 | -- | |
| Wood Randall G | $337,000 | -- |
Source: Public Records
Mortgage History
| Date | Status | Borrower | Loan Amount |
|---|---|---|---|
| Open | Wood Randall G | $269,600 | |
| Closed | Wood Randall G | $269,600 |
Source: Public Records
Tax History
| Year | Tax Paid | Tax Assessment Tax Assessment Total Assessment is a certain percentage of the fair market value that is determined by local assessors to be the total taxable value of land and additions on the property. | Land | Improvement |
|---|---|---|---|---|
| 2025 | $5,902 | $509,700 | $0 | $509,700 |
| 2024 | $4,992 | $458,000 | $0 | $458,000 |
| 2023 | $4,729 | $440,300 | $0 | $440,300 |
| 2022 | $4,562 | $419,300 | $0 | $419,300 |
| 2021 | $4,386 | $411,100 | $0 | $411,100 |
| 2020 | $3,071 | $290,800 | $0 | $290,800 |
| 2019 | $2,786 | $264,300 | $0 | $264,300 |
| 2018 | $2,517 | $240,200 | $0 | $240,200 |
| 2017 | $2,377 | $224,500 | $0 | $224,500 |
| 2016 | $2,308 | $209,800 | $0 | $209,800 |
| 2015 | $2,353 | $194,300 | $0 | $194,300 |
| 2014 | $2,306 | $183,300 | $0 | $183,300 |
Source: Public Records
Map
Nearby Homes
- 65 Lambert Ave
- 16 Hawthorne St
- 9 W Cedar St Unit 1
- 156-160 Highland St Unit 156
- 10 Linwood St
- 27 Dudley St
- 51 Saint James St
- 64 Alpine St Unit 104
- 64 Alpine St Unit 304
- 187 Highland St
- 48-50 Dudley St
- 5 Valentine St Unit 1
- 21 Marcella St Unit 2
- 2856 Washington St
- 16 Mayfair St
- 22 Rockville Park
- 20 Rockville Park
- 80 Terrace St Unit 501
- 134 Terrace St
- 150 Walnut Ave
- 6 Logan St Unit 2
- 6 Logan St Unit 1
- 6 Logan St
- 4 Logan St
- 80 Lambert Ave
- 64 Lambert Ave
- 12 Logan St Unit 14
- 12 Logan St Unit 12
- 12 Logan St Unit Logan St
- 12 Logan St
- 12 Logan St Unit 2
- 12 Logan St Unit 1
- 14 Logan St Unit 14
- 14 Logan St
- 14 Logan St Unit 1
- 14 Logan St Unit 2
- 16 Logan St Unit 18
- 4 Rockledge St
- 4 Rockledge St Unit 2
- 4 Rockledge St Unit A
Your Personal Tour Guide
Ask me questions while you tour the home.