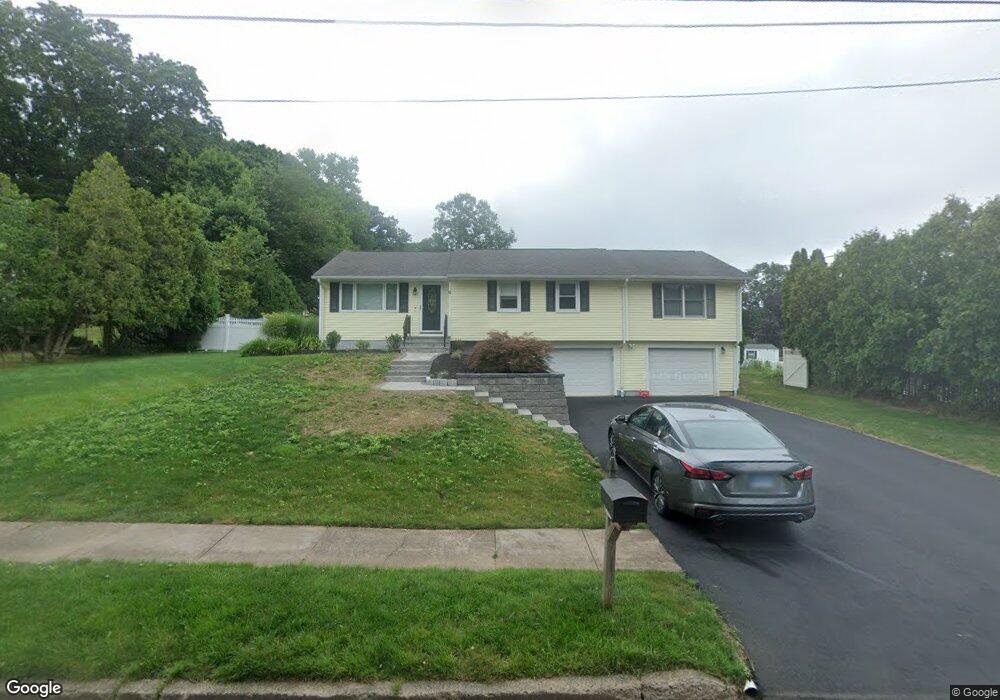
6 Lori Ln Wallingford, CT 06492
Estimated Value: $447,000 - $524,000
4
Beds
3
Baths
1,696
Sq Ft
$283/Sq Ft
Est. Value
About This Home
This home is located at 6 Lori Ln, Wallingford, CT 06492 and is currently estimated at $479,584, approximately $282 per square foot. 6 Lori Ln is a home located in New Haven County with nearby schools including Evarts C. Stevens School, Parker Farms School, and James H. Moran Middle School.
Ownership History
Date
Name
Owned For
Owner Type
Purchase Details
Closed on
Jan 21, 2003
Sold by
Listro James C and Geltman Randi E
Bought by
Grossman Jeremy J and Grossman Karen L
Current Estimated Value
Purchase Details
Closed on
Nov 2, 1989
Sold by
Marenna Anthony G
Bought by
Listro James C
Create a Home Valuation Report for This Property
The Home Valuation Report is an in-depth analysis detailing your home's value as well as a comparison with similar homes in the area
Home Values in the Area
Average Home Value in this Area
Purchase History
| Date | Buyer | Sale Price | Title Company |
|---|---|---|---|
| Grossman Jeremy J | $225,000 | -- | |
| Grossman Jeremy J | $225,000 | -- | |
| Listro James C | $143,000 | -- |
Source: Public Records
Mortgage History
| Date | Status | Borrower | Loan Amount |
|---|---|---|---|
| Open | Listro James C | $161,135 | |
| Closed | Listro James C | $136,339 | |
| Closed | Listro James C | $235,200 |
Source: Public Records
Tax History
| Year | Tax Paid | Tax Assessment Tax Assessment Total Assessment is a certain percentage of the fair market value that is determined by local assessors to be the total taxable value of land and additions on the property. | Land | Improvement |
|---|---|---|---|---|
| 2025 | $7,166 | $297,100 | $94,600 | $202,500 |
| 2024 | $6,178 | $201,500 | $78,800 | $122,700 |
| 2023 | $5,912 | $201,500 | $78,800 | $122,700 |
| 2022 | $5,852 | $201,500 | $78,800 | $122,700 |
| 2021 | $5,747 | $201,500 | $78,800 | $122,700 |
| 2020 | $5,301 | $181,600 | $77,500 | $104,100 |
| 2019 | $5,301 | $181,600 | $77,500 | $104,100 |
| 2018 | $5,005 | $181,600 | $77,500 | $104,100 |
| 2017 | $4,908 | $181,600 | $77,500 | $104,100 |
| 2016 | $5,065 | $181,600 | $77,500 | $104,100 |
| 2015 | $5,197 | $189,200 | $77,500 | $111,700 |
| 2014 | $5,088 | $189,200 | $77,500 | $111,700 |
Source: Public Records
Map
Nearby Homes
- 196 Parker Farms Rd
- 39 Ridgecrest Rd
- 204 Parker Farms Rd
- 30 Crestview Terrace
- 36 Apple St
- 22 Harnish Ln
- 4 Gregory Rd
- 23 Ridgefield Rd
- 30 King St
- 15 Johnson Rd
- 230 Main St Unit 38
- 230 Main St Unit 18
- 54 High St
- 1116 Wallingford Rd
- 61 Cheshire Rd
- 90 Masonic Ave
- 30 Clinton Place
- 8 High St
- 31 S Turnpike Rd Unit C2
- 380 Main St Unit 45
Your Personal Tour Guide
Ask me questions while you tour the home.