6 Lower Rd Hudson, MA 01749
Estimated Value: $817,828 - $880,000
About This Home
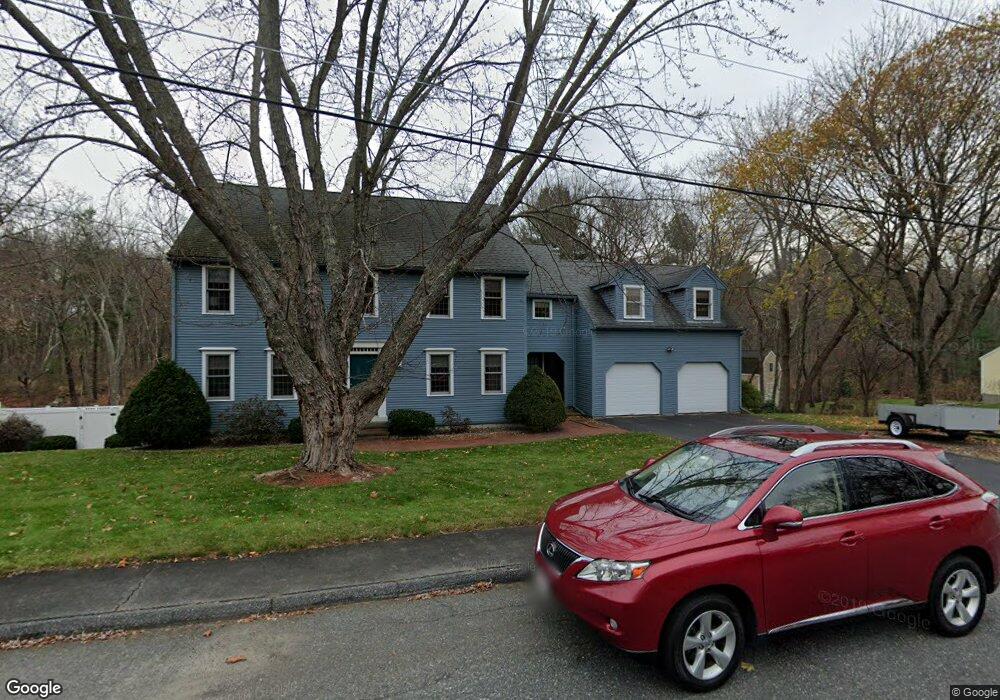
This home is located at 6 Lower Rd, Hudson, MA 01749 and is currently estimated at $854,957, approximately $308 per square foot. 6 Lower Rd is a home located in Middlesex County with nearby schools including David J. Quinn Middle School, Hudson High School, and First Steps Children's Center.
Ownership History
We collect this data history from publicly available records. To have your information removed, we recommend requesting removal directly through your county’s website.
Purchase Details
Home Financials for this Owner
Home Financials are based on the most recent Mortgage that was taken out on this home.Purchase Details
Purchase Details
Home Values in the Area
Average Home Value in this Area
Purchase History
We collect this data history from publicly available records. To have your information removed, we recommend requesting removal directly through your county’s website.
| Date | Buyer | Sale Price | Title Company |
|---|---|---|---|
| $589,900 | None Available | ||
| $589,900 | None Available | ||
| -- | -- | ||
| -- | -- | ||
| -- | -- |
Mortgage History
We collect this data history from publicly available records. To have your information removed, we recommend requesting removal directly through your county’s website.
| Date | Status | Borrower | Loan Amount |
|---|---|---|---|
| Open | $471,920 | ||
| Closed | $471,920 |
Tax History
We collect this data history from publicly available records. To have your information removed, we recommend requesting removal directly through your county’s website.
| Year | Tax Paid | Tax Assessment Tax Assessment Total Assessment is a certain percentage of the fair market value that is determined by local assessors to be the total taxable value of land and additions on the property. | Land | Improvement |
|---|---|---|---|---|
| 2025 | $10,364 | $746,700 | $235,800 | $510,900 |
| 2024 | $10,133 | $723,800 | $214,200 | $509,600 |
| 2023 | $9,331 | $639,100 | $206,300 | $432,800 |
| 2022 | $9,294 | $586,000 | $187,500 | $398,500 |
| 2021 | $8,836 | $532,600 | $178,700 | $353,900 |
| 2020 | $8,662 | $521,500 | $175,100 | $346,400 |
| 2019 | $8,183 | $480,500 | $175,100 | $305,400 |
| 2018 | $7,972 | $465,300 | $166,700 | $298,600 |
| 2017 | $7,756 | $443,200 | $158,700 | $284,500 |
| 2016 | $7,222 | $417,700 | $158,700 | $259,000 |
| 2015 | $7,265 | $420,700 | $158,700 | $262,000 |
| 2014 | $6,984 | $400,900 | $139,100 | $261,800 |
Map
- 106 Causeway St
- 92 Hosmer St
- 12 Murphy Rd
- 4 Richardson Rd
- 144 Brook St
- 155 Brook St
- 27 Richardson Rd
- 44 Fort Meadow Dr
- 21 Michigan Dr
- 33 Russo Dr
- 26 Causeway St
- 7 Richard Rd
- 303 Lakeshore Dr
- 19 Macintosh Ave
- 307 Chestnut St
- 1 Glendale Rd
- 22 Sauta Farm Way
- 3 Strawberry Ln Unit A
- 48 Jewell Rd Unit Lot 6
- 425 Main St Unit 11B
Ask me questions while you tour the home.