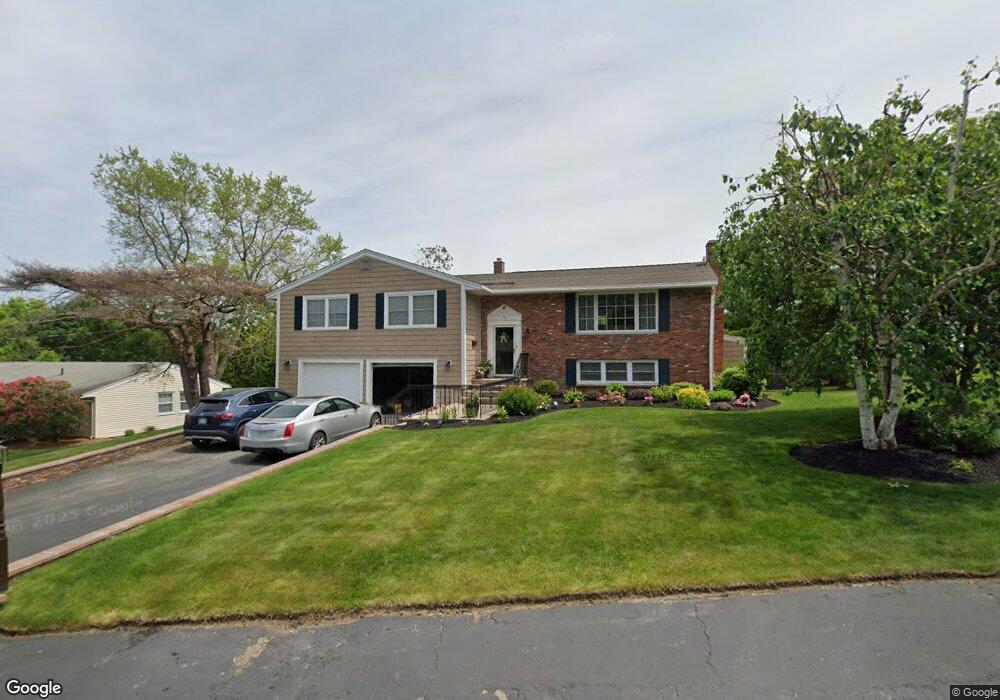
6 Lowman Cir Peabody, MA 01960
West Peabody NeighborhoodEstimated Value: $864,771 - $992,000
3
Beds
3
Baths
2,174
Sq Ft
$418/Sq Ft
Est. Value
About This Home
This home is located at 6 Lowman Cir, Peabody, MA 01960 and is currently estimated at $907,693, approximately $417 per square foot. 6 Lowman Cir is a home located in Essex County with nearby schools including Peabody Veterans Memorial High School, Covenant Christian Academy, and Our Lady Of Assumption School.
Ownership History
Date
Name
Owned For
Owner Type
Purchase Details
Closed on
Feb 5, 2025
Sold by
Gikas Evangelos A
Bought by
Gikas Evangelos A and Gikas Nicole M
Current Estimated Value
Purchase Details
Closed on
Nov 29, 1993
Sold by
Est Gikas Akis and Gikas George A
Bought by
Gikas George A and Gikas Evangelos A
Purchase Details
Closed on
Aug 17, 1989
Sold by
Gikas Elaine
Bought by
Gikas Archilles
Create a Home Valuation Report for This Property
The Home Valuation Report is an in-depth analysis detailing your home's value as well as a comparison with similar homes in the area
Home Values in the Area
Average Home Value in this Area
Purchase History
| Date | Buyer | Sale Price | Title Company |
|---|---|---|---|
| Gikas Evangelos A | -- | None Available | |
| Gikas Evangelos A | -- | None Available | |
| Gikas George A | $168,750 | -- | |
| Gikas George A | $168,750 | -- | |
| Gikas Archilles | $63,000 | -- | |
| Gikas Archilles | $63,000 | -- |
Source: Public Records
Mortgage History
| Date | Status | Borrower | Loan Amount |
|---|---|---|---|
| Previous Owner | Gikas Archilles | $265,000 | |
| Previous Owner | Gikas Archilles | $265,000 |
Source: Public Records
Tax History Compared to Growth
Tax History
| Year | Tax Paid | Tax Assessment Tax Assessment Total Assessment is a certain percentage of the fair market value that is determined by local assessors to be the total taxable value of land and additions on the property. | Land | Improvement |
|---|---|---|---|---|
| 2025 | $7,324 | $790,900 | $321,900 | $469,000 |
| 2024 | $6,986 | $766,000 | $321,900 | $444,100 |
| 2023 | $6,273 | $658,900 | $268,300 | $390,600 |
| 2022 | $6,059 | $599,900 | $233,300 | $366,600 |
| 2021 | $6,024 | $574,300 | $212,100 | $362,200 |
| 2020 | $5,985 | $557,300 | $212,100 | $345,200 |
| 2019 | $5,861 | $532,300 | $212,100 | $320,200 |
| 2018 | $5,555 | $484,700 | $189,400 | $295,300 |
| 2017 | $5,594 | $475,700 | $189,400 | $286,300 |
| 2016 | $5,328 | $447,000 | $189,400 | $257,600 |
| 2015 | $5,138 | $417,700 | $189,400 | $228,300 |
Source: Public Records
Map
Nearby Homes