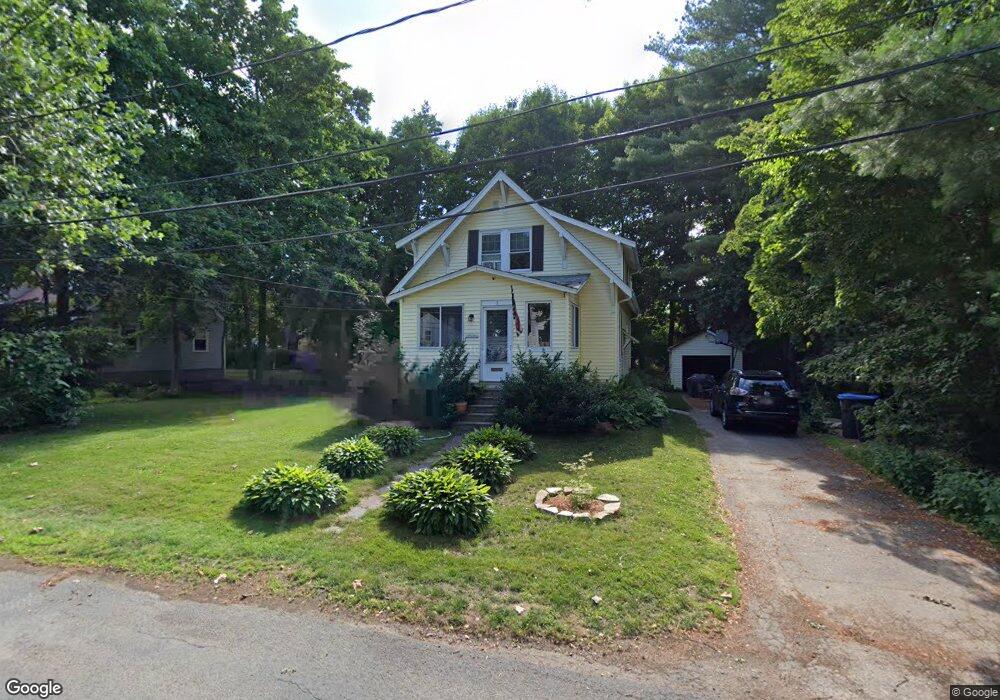
6 Lupine Rd Natick, MA 01760
Estimated Value: $634,735 - $733,000
3
Beds
1
Bath
1,001
Sq Ft
$674/Sq Ft
Est. Value
About This Home
This home is located at 6 Lupine Rd, Natick, MA 01760 and is currently estimated at $674,184, approximately $673 per square foot. 6 Lupine Rd is a home located in Middlesex County with nearby schools including Natick High School, Wilson Middle School, and Bennett-Hemenway (Ben-Hem) Elementary School.
Ownership History
Date
Name
Owned For
Owner Type
Purchase Details
Closed on
Jun 3, 2013
Sold by
Mary P Kelly Rt
Bought by
Laracy Nicole L
Current Estimated Value
Home Financials for this Owner
Home Financials are based on the most recent Mortgage that was taken out on this home.
Original Mortgage
$289,750
Outstanding Balance
$205,744
Interest Rate
3.45%
Mortgage Type
New Conventional
Estimated Equity
$468,440
Create a Home Valuation Report for This Property
The Home Valuation Report is an in-depth analysis detailing your home's value as well as a comparison with similar homes in the area
Home Values in the Area
Average Home Value in this Area
Purchase History
| Date | Buyer | Sale Price | Title Company |
|---|---|---|---|
| Laracy Nicole L | $305,000 | -- | |
| Laracy Nicole L | $305,000 | -- |
Source: Public Records
Mortgage History
| Date | Status | Borrower | Loan Amount |
|---|---|---|---|
| Open | Laracy Nicole L | $289,750 | |
| Closed | Laracy Nicole L | $289,750 |
Source: Public Records
Tax History
| Year | Tax Paid | Tax Assessment Tax Assessment Total Assessment is a certain percentage of the fair market value that is determined by local assessors to be the total taxable value of land and additions on the property. | Land | Improvement |
|---|---|---|---|---|
| 2025 | $6,974 | $583,100 | $438,700 | $144,400 |
| 2024 | $6,754 | $550,900 | $414,400 | $136,500 |
| 2023 | $6,743 | $533,500 | $390,000 | $143,500 |
| 2022 | $6,503 | $487,500 | $355,900 | $131,600 |
| 2021 | $4,650 | $460,200 | $336,400 | $123,800 |
| 2020 | $6,063 | $445,500 | $321,700 | $123,800 |
| 2019 | $5,662 | $445,500 | $321,700 | $123,800 |
| 2018 | $6,966 | $404,200 | $292,500 | $111,700 |
| 2017 | $4,964 | $368,000 | $258,400 | $109,600 |
| 2016 | $4,694 | $345,900 | $243,500 | $102,400 |
| 2015 | $4,500 | $325,600 | $243,500 | $82,100 |
Source: Public Records
Map
Nearby Homes
Your Personal Tour Guide
Ask me questions while you tour the home.