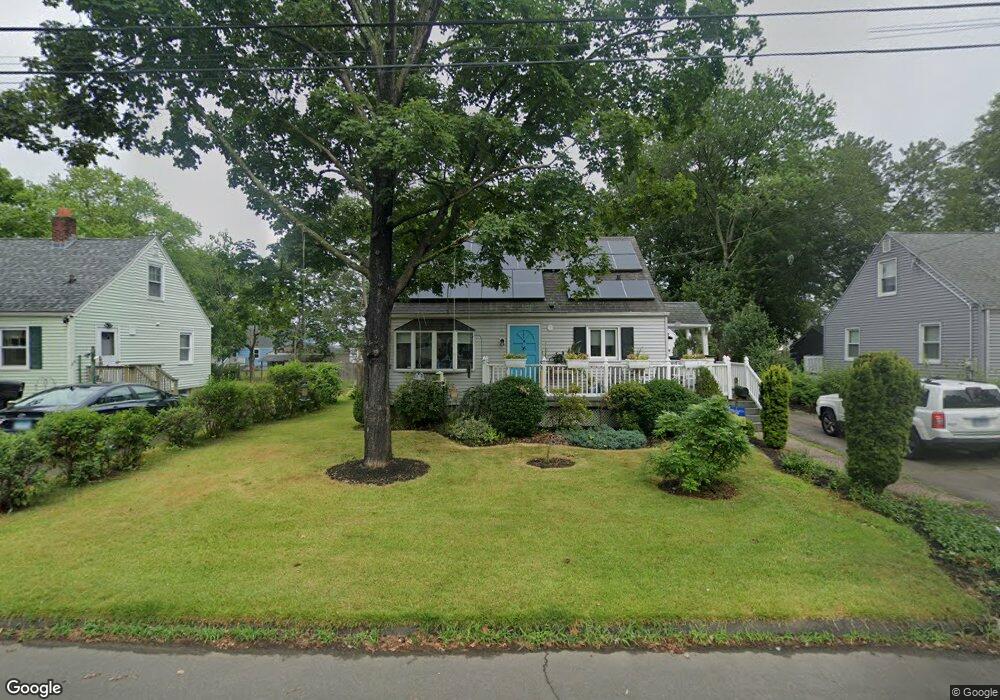
6 Lynette Dr North Haven, CT 06473
Estimated Value: $460,000 - $598,000
3
Beds
4
Baths
2,249
Sq Ft
$230/Sq Ft
Est. Value
About This Home
This home is located at 6 Lynette Dr, North Haven, CT 06473 and is currently estimated at $517,675, approximately $230 per square foot. 6 Lynette Dr is a home located in New Haven County with nearby schools including North Haven Middle School and North Haven High School.
Ownership History
Date
Name
Owned For
Owner Type
Purchase Details
Closed on
Mar 20, 2020
Sold by
Alicandro Dawn M
Bought by
Cagnetta Laurie A
Current Estimated Value
Home Financials for this Owner
Home Financials are based on the most recent Mortgage that was taken out on this home.
Original Mortgage
$264,000
Outstanding Balance
$230,801
Interest Rate
3.4%
Mortgage Type
New Conventional
Estimated Equity
$286,874
Purchase Details
Closed on
Dec 1, 1998
Sold by
Tomaszewski Alan R
Bought by
Cagnetta Laurie A and Alicandro Dawn M
Purchase Details
Closed on
Apr 27, 1998
Sold by
Antonucci Deborah A and Antonucci Pasquale
Bought by
Dimaggio Barry J and Montana Regina
Purchase Details
Closed on
Sep 11, 1991
Sold by
Tomaszewski Alice C
Bought by
Tomaszewski Alan R
Create a Home Valuation Report for This Property
The Home Valuation Report is an in-depth analysis detailing your home's value as well as a comparison with similar homes in the area
Home Values in the Area
Average Home Value in this Area
Purchase History
| Date | Buyer | Sale Price | Title Company |
|---|---|---|---|
| Cagnetta Laurie A | -- | None Available | |
| Cagnetta Laurie A | $158,500 | -- | |
| Dimaggio Barry J | $119,500 | -- | |
| Tomaszewski Alan R | $116,000 | -- |
Source: Public Records
Mortgage History
| Date | Status | Borrower | Loan Amount |
|---|---|---|---|
| Open | Cagnetta Laurie A | $264,000 | |
| Previous Owner | Tomaszewski Alan R | $321,733 | |
| Previous Owner | Tomaszewski Alan R | $18,000 |
Source: Public Records
Tax History
| Year | Tax Paid | Tax Assessment Tax Assessment Total Assessment is a certain percentage of the fair market value that is determined by local assessors to be the total taxable value of land and additions on the property. | Land | Improvement |
|---|---|---|---|---|
| 2025 | $8,117 | $275,520 | $65,170 | $210,350 |
| 2024 | $6,355 | $183,460 | $65,160 | $118,300 |
| 2023 | $5,990 | $183,460 | $65,160 | $118,300 |
| 2022 | $5,634 | $183,460 | $65,160 | $118,300 |
| 2021 | $8,162 | $183,460 | $65,160 | $118,300 |
| 2020 | $5,636 | $183,460 | $65,160 | $118,300 |
| 2019 | $6,159 | $197,540 | $70,210 | $127,330 |
| 2018 | $6,159 | $197,540 | $70,210 | $127,330 |
| 2017 | $6,041 | $197,540 | $70,210 | $127,330 |
| 2016 | $6,031 | $197,540 | $70,210 | $127,330 |
| 2015 | $5,812 | $197,540 | $70,210 | $127,330 |
| 2014 | $5,742 | $204,330 | $78,610 | $125,720 |
Source: Public Records
Map
Nearby Homes
- 101 Pool Rd
- 24 North Ave
- 26 Susan Ln
- 50 Bassett Rd
- 140 Shawmut Ave
- 71 Leonardo Dr
- 9 Russell Rd
- 21 Fieldstone Ct Unit 21
- 22 Fieldstone Ct Unit 22
- 6 Liberty Terrace
- 6 Carriage Dr
- 45 Pond Hill Lot 3 Rd
- 1400 Hartford Turnpike Unit 24
- 36 Corey Rd
- 7 Old Forge Rd
- 10 Ball Rd
- 6 Waterbury Rd
- 137 Mulholland Way Unit 83
- 63 Sackett Point Rd
- 1866 Hartford Turnpike
Your Personal Tour Guide
Ask me questions while you tour the home.