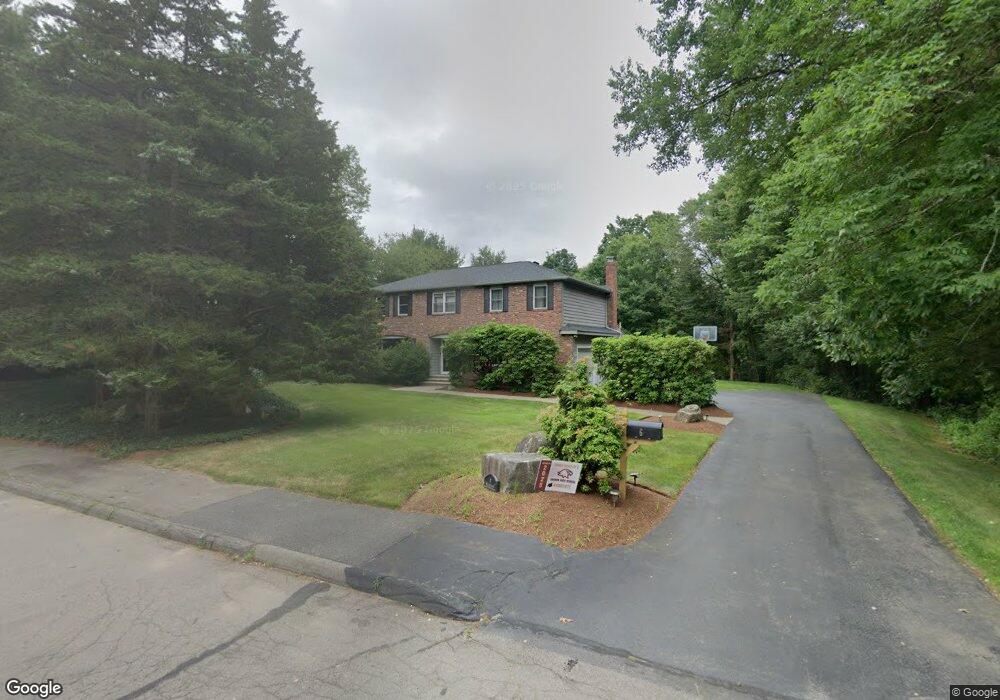
6 Mallard Dr Sharon, MA 02067
Estimated Value: $1,083,001 - $1,369,000
5
Beds
4
Baths
3,600
Sq Ft
$334/Sq Ft
Est. Value
About This Home
This home is located at 6 Mallard Dr, Sharon, MA 02067 and is currently estimated at $1,203,500, approximately $334 per square foot. 6 Mallard Dr is a home located in Norfolk County with nearby schools including East Elementary School, Sharon Middle School, and Sharon High School.
Ownership History
Date
Name
Owned For
Owner Type
Purchase Details
Closed on
Nov 10, 2022
Sold by
Kini Sunil S and Kini Reshma S
Bought by
Reshma Sunil 2022 T
Current Estimated Value
Purchase Details
Closed on
Aug 29, 2008
Sold by
Shocket Jon D and Shocket Mahra
Bought by
Kini Reshma S and Kini Sunil S
Home Financials for this Owner
Home Financials are based on the most recent Mortgage that was taken out on this home.
Original Mortgage
$499,999
Interest Rate
6.29%
Mortgage Type
Purchase Money Mortgage
Purchase Details
Closed on
Nov 15, 2002
Sold by
Darrer Beryl D
Bought by
Shocket Jon D and Shocket Mahra
Home Financials for this Owner
Home Financials are based on the most recent Mortgage that was taken out on this home.
Original Mortgage
$420,000
Interest Rate
6.03%
Mortgage Type
Purchase Money Mortgage
Create a Home Valuation Report for This Property
The Home Valuation Report is an in-depth analysis detailing your home's value as well as a comparison with similar homes in the area
Home Values in the Area
Average Home Value in this Area
Purchase History
| Date | Buyer | Sale Price | Title Company |
|---|---|---|---|
| Reshma Sunil 2022 T | -- | None Available | |
| Kini Reshma S | $630,000 | -- | |
| Shocket Jon D | $542,500 | -- |
Source: Public Records
Mortgage History
| Date | Status | Borrower | Loan Amount |
|---|---|---|---|
| Previous Owner | Kini Reshma S | $499,999 | |
| Previous Owner | Shocket Jon D | $420,000 |
Source: Public Records
Tax History
| Year | Tax Paid | Tax Assessment Tax Assessment Total Assessment is a certain percentage of the fair market value that is determined by local assessors to be the total taxable value of land and additions on the property. | Land | Improvement |
|---|---|---|---|---|
| 2025 | $16,235 | $928,800 | $485,400 | $443,400 |
| 2024 | $15,560 | $885,100 | $445,300 | $439,800 |
| 2023 | $14,876 | $800,200 | $416,400 | $383,800 |
| 2022 | $14,096 | $713,700 | $346,900 | $366,800 |
| 2021 | $13,968 | $683,700 | $327,100 | $356,600 |
| 2020 | $12,990 | $683,700 | $327,100 | $356,600 |
| 2019 | $12,832 | $661,100 | $304,500 | $356,600 |
| 2018 | $12,693 | $655,300 | $298,700 | $356,600 |
| 2017 | $12,476 | $635,900 | $279,300 | $356,600 |
| 2016 | $12,171 | $605,200 | $279,300 | $325,900 |
| 2015 | $11,945 | $588,400 | $260,300 | $328,100 |
| 2014 | $11,062 | $538,300 | $236,700 | $301,600 |
Source: Public Records
Map
Nearby Homes
- 4 Robinette Rd
- 157 Wilshire Dr
- 9 Williams Rd
- 70 Deerfield Rd
- 12 Eastwood Rd
- 17 Donald Rd
- 7 Belcher St
- Lot 4 West St
- 34 Copperwood Dr Unit 34
- 438 School St
- 22 Magnolia Rd
- 25 Bayberry Dr Unit 1
- 2 Palace Ct
- 296 Island St
- 115 Kennedy Rd
- 12 Greenbrook Dr
- 117 Greenbrook Dr
- 109 Greenbrook Dr Unit 109
- 67 Greenbrook Dr Unit 67
- 49 Elderwood Dr Unit 49
Your Personal Tour Guide
Ask me questions while you tour the home.