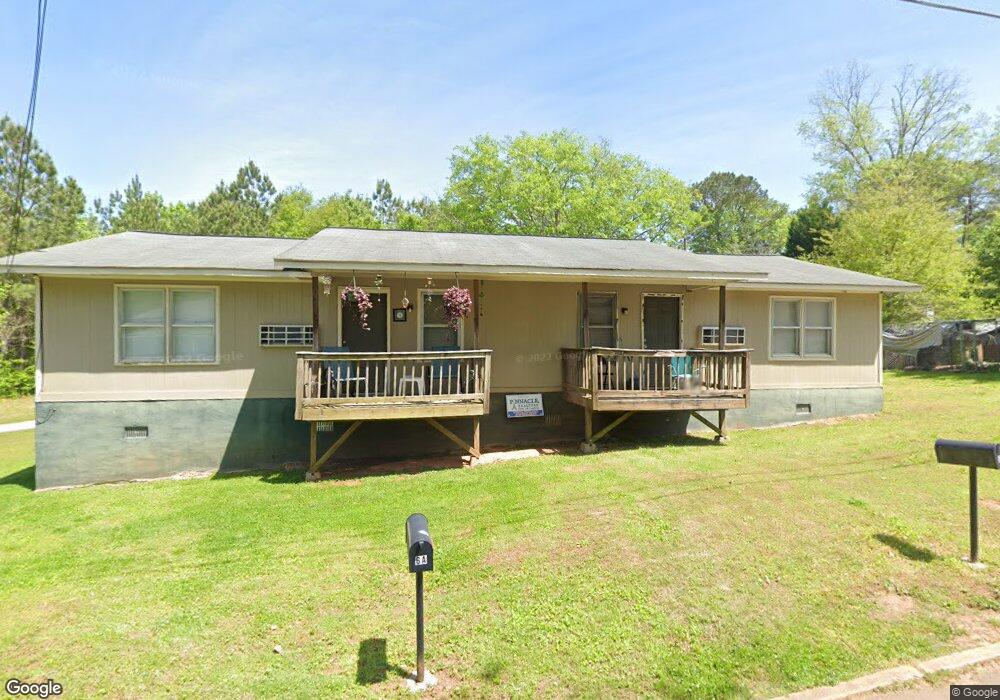
6 Maple St Unit B Covington, GA 30014
Estimated Value: $161,000 - $194,000
2
Beds
1
Bath
1,534
Sq Ft
$114/Sq Ft
Est. Value
About This Home
This home is located at 6 Maple St Unit B, Covington, GA 30014 and is currently estimated at $175,077, approximately $114 per square foot. 6 Maple St Unit B is a home located in Newton County with nearby schools including Middle Ridge Elementary School, Clements Middle School, and Newton High School.
Ownership History
Date
Name
Owned For
Owner Type
Purchase Details
Closed on
Aug 26, 2021
Sold by
Gibson Connie S
Bought by
Eberhardt Paul S and Eberhardt Christina L
Current Estimated Value
Home Financials for this Owner
Home Financials are based on the most recent Mortgage that was taken out on this home.
Original Mortgage
$115,500
Outstanding Balance
$104,407
Interest Rate
2.8%
Mortgage Type
New Conventional
Estimated Equity
$70,670
Purchase Details
Closed on
Dec 21, 2020
Sold by
Gibson Raymond R
Bought by
Gibson Connie S and Connie S Gibson Rev Trust
Purchase Details
Closed on
Apr 30, 2007
Sold by
Phillips Claude R and Phillips Jean C
Bought by
Gibson Steve
Home Financials for this Owner
Home Financials are based on the most recent Mortgage that was taken out on this home.
Original Mortgage
$25,000
Interest Rate
6.1%
Mortgage Type
Trade
Create a Home Valuation Report for This Property
The Home Valuation Report is an in-depth analysis detailing your home's value as well as a comparison with similar homes in the area
Home Values in the Area
Average Home Value in this Area
Purchase History
| Date | Buyer | Sale Price | Title Company |
|---|---|---|---|
| Eberhardt Paul S | $154,000 | -- | |
| Gibson Connie S | -- | -- | |
| Gibson Steve | $30,000 | -- |
Source: Public Records
Mortgage History
| Date | Status | Borrower | Loan Amount |
|---|---|---|---|
| Open | Eberhardt Paul S | $115,500 | |
| Previous Owner | Gibson Steve | $25,000 |
Source: Public Records
Tax History
| Year | Tax Paid | Tax Assessment Tax Assessment Total Assessment is a certain percentage of the fair market value that is determined by local assessors to be the total taxable value of land and additions on the property. | Land | Improvement |
|---|---|---|---|---|
| 2025 | $2,904 | $74,880 | $10,000 | $64,880 |
| 2024 | $2,704 | $68,920 | $10,000 | $58,920 |
| 2023 | $2,455 | $59,680 | $5,600 | $54,080 |
| 2022 | $1,983 | $48,200 | $5,600 | $42,600 |
| 2021 | $1,346 | $30,320 | $5,600 | $24,720 |
| 2020 | $886 | $26,360 | $5,600 | $20,760 |
| 2019 | $838 | $24,560 | $5,600 | $18,960 |
| 2018 | $775 | $22,560 | $5,600 | $16,960 |
| 2017 | $567 | $16,520 | $3,280 | $13,240 |
| 2016 | $567 | $16,520 | $3,280 | $13,240 |
| 2015 | $567 | $16,520 | $3,200 | $13,320 |
| 2014 | $390 | $18,560 | $0 | $0 |
Source: Public Records
Map
Nearby Homes
Your Personal Tour Guide
Ask me questions while you tour the home.