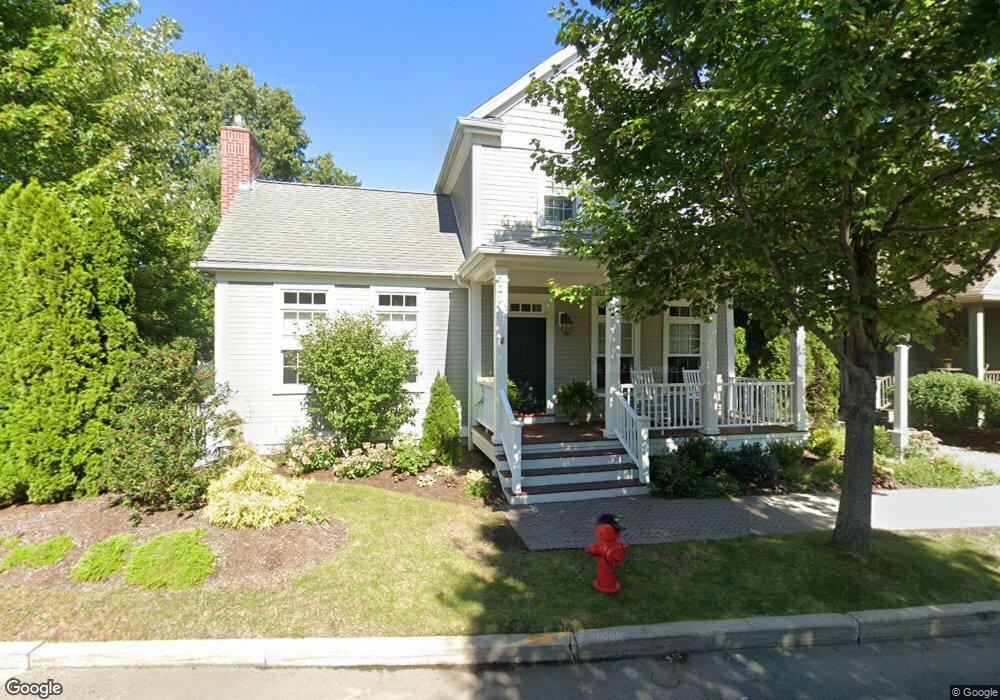
6 Maple St Unit 6 Medfield, MA 02052
Estimated Value: $1,203,734 - $1,358,000
2
Beds
3
Baths
2,400
Sq Ft
$533/Sq Ft
Est. Value
About This Home
This home is located at 6 Maple St Unit 6, Medfield, MA 02052 and is currently estimated at $1,279,434, approximately $533 per square foot. 6 Maple St Unit 6 is a home located in Norfolk County with nearby schools including Memorial School, Ralph Wheelock School, and Dale Street School.
Ownership History
Date
Name
Owned For
Owner Type
Purchase Details
Closed on
Nov 9, 2018
Sold by
Perini David B
Bought by
Judith A Smith 2018 Ret and Smith
Current Estimated Value
Purchase Details
Closed on
Oct 4, 2013
Sold by
Quinnette Timothy M and Quinnette Denise A
Bought by
Perini David P and Perini Eileen
Purchase Details
Closed on
Aug 31, 2010
Sold by
Olde Village Square Co
Bought by
Quinnette Timothy M and Quinnette Denise A
Home Financials for this Owner
Home Financials are based on the most recent Mortgage that was taken out on this home.
Original Mortgage
$711,920
Interest Rate
4.57%
Mortgage Type
Purchase Money Mortgage
Create a Home Valuation Report for This Property
The Home Valuation Report is an in-depth analysis detailing your home's value as well as a comparison with similar homes in the area
Home Values in the Area
Average Home Value in this Area
Purchase History
| Date | Buyer | Sale Price | Title Company |
|---|---|---|---|
| Judith A Smith 2018 Ret | $856,000 | -- | |
| Judith A Smith 2018 Ret | $856,000 | -- | |
| Perini David P | $959,000 | -- | |
| Perini David P | $959,000 | -- | |
| Quinnette Timothy M | $895,072 | -- | |
| Quinnette Timothy M | $895,072 | -- |
Source: Public Records
Mortgage History
| Date | Status | Borrower | Loan Amount |
|---|---|---|---|
| Previous Owner | Quinnette Timothy M | $704,000 | |
| Previous Owner | Quinnette Timothy M | $711,920 |
Source: Public Records
Tax History Compared to Growth
Tax History
| Year | Tax Paid | Tax Assessment Tax Assessment Total Assessment is a certain percentage of the fair market value that is determined by local assessors to be the total taxable value of land and additions on the property. | Land | Improvement |
|---|---|---|---|---|
| 2025 | $13,616 | $986,700 | $0 | $986,700 |
| 2024 | $13,789 | $941,900 | $0 | $941,900 |
| 2023 | $14,250 | $923,500 | $0 | $923,500 |
| 2022 | $14,901 | $855,400 | $0 | $855,400 |
| 2021 | $15,004 | $844,800 | $0 | $844,800 |
| 2020 | $15,063 | $844,800 | $0 | $844,800 |
| 2019 | $15,227 | $852,100 | $0 | $852,100 |
| 2018 | $14,874 | $873,400 | $0 | $873,400 |
| 2017 | $14,752 | $873,400 | $0 | $873,400 |
| 2016 | $14,629 | $873,400 | $0 | $873,400 |
| 2015 | $13,510 | $842,300 | $0 | $842,300 |
| 2014 | $13,302 | $825,200 | $0 | $825,200 |
Source: Public Records
Map
Nearby Homes