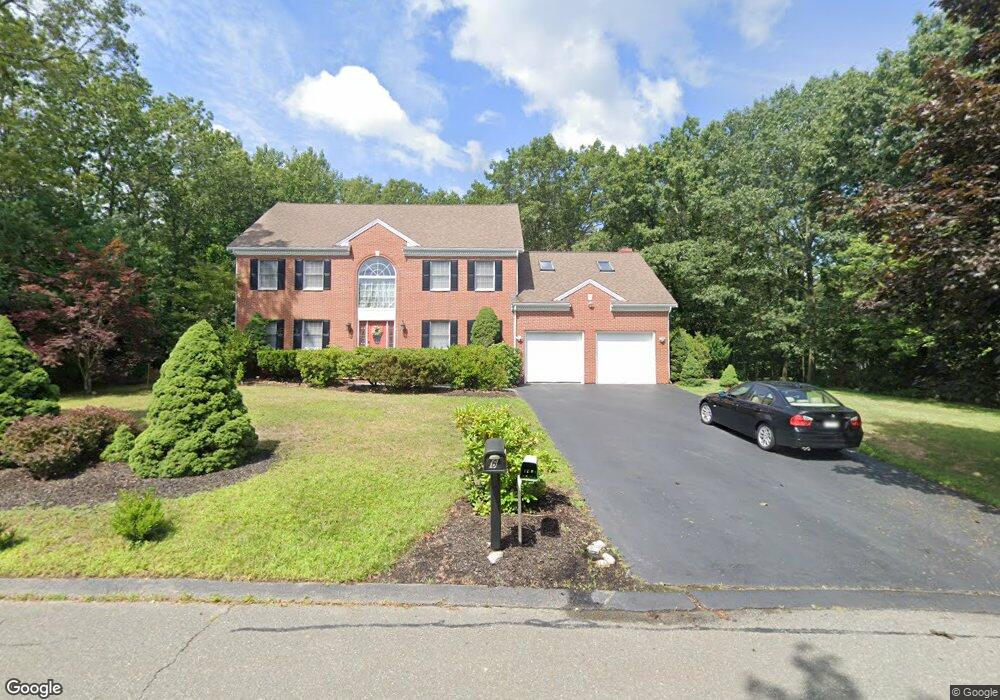
6 Maplewood Rd Middleton, MA 01949
Estimated Value: $1,250,169 - $1,766,000
4
Beds
4
Baths
3,592
Sq Ft
$395/Sq Ft
Est. Value
About This Home
This home is located at 6 Maplewood Rd, Middleton, MA 01949 and is currently estimated at $1,418,292, approximately $394 per square foot. 6 Maplewood Rd is a home located in Essex County with nearby schools including Howe-Manning Elementary School, Fuller Meadow Elementary School, and Masconomet Regional Middle School.
Ownership History
Date
Name
Owned For
Owner Type
Purchase Details
Closed on
May 17, 2023
Sold by
Gopal Papaiah and Gopal Pushpa
Bought by
Gopal Papaiah
Current Estimated Value
Purchase Details
Closed on
Apr 8, 1994
Sold by
Chan Kam P and Chan Krisna
Bought by
Gopal Papaiah and Gopal Pushpa
Home Financials for this Owner
Home Financials are based on the most recent Mortgage that was taken out on this home.
Original Mortgage
$252,000
Interest Rate
7.27%
Mortgage Type
Purchase Money Mortgage
Create a Home Valuation Report for This Property
The Home Valuation Report is an in-depth analysis detailing your home's value as well as a comparison with similar homes in the area
Home Values in the Area
Average Home Value in this Area
Purchase History
| Date | Buyer | Sale Price | Title Company |
|---|---|---|---|
| Gopal Papaiah | -- | None Available | |
| Gopal Papaiah | -- | None Available | |
| Gopal Papaiah | -- | None Available | |
| Gopal Papaiah | $315,000 | -- | |
| Gopal Papaiah | $315,000 | -- |
Source: Public Records
Mortgage History
| Date | Status | Borrower | Loan Amount |
|---|---|---|---|
| Previous Owner | Gopal Papaiah | $150,000 | |
| Previous Owner | Gopal Papaiah | $252,000 | |
| Previous Owner | Gopal Papaiah | $130,000 |
Source: Public Records
Tax History Compared to Growth
Tax History
| Year | Tax Paid | Tax Assessment Tax Assessment Total Assessment is a certain percentage of the fair market value that is determined by local assessors to be the total taxable value of land and additions on the property. | Land | Improvement |
|---|---|---|---|---|
| 2025 | $12,864 | $1,081,900 | $430,000 | $651,900 |
| 2024 | $12,322 | $1,045,100 | $402,000 | $643,100 |
| 2023 | $11,918 | $926,000 | $440,000 | $486,000 |
| 2022 | $10,444 | $788,200 | $348,000 | $440,200 |
| 2021 | $10,334 | $753,200 | $330,000 | $423,200 |
| 2020 | $10,459 | $767,900 | $340,000 | $427,900 |
| 2019 | $10,162 | $742,300 | $324,000 | $418,300 |
| 2018 | $10,139 | $726,300 | $318,000 | $408,300 |
| 2017 | $9,406 | $674,300 | $272,000 | $402,300 |
| 2016 | $9,067 | $652,800 | $256,000 | $396,800 |
| 2015 | $8,902 | $646,000 | $252,000 | $394,000 |
Source: Public Records
Map
Nearby Homes
- 15 Peachey Cir Unit 204
- 8 Brookside Rd
- 119 River St
- 1 Couture Way
- 37 Peaslee Cir Unit 37
- 15 Couture Way
- 2 Tyler Ln
- 1 Mills Point Unit 1
- 67 Fuller Pond Rd
- 62 Cabral Dr
- 6 White Ln
- 1 Overbrook Rd
- 11 Murray St
- 360 Andover St Unit 1310
- 62 Catherine Dr
- 264 Centre St
- 35 Catherine Dr
- 1466 Main St
- 2 Pat Dr
- 5 Stableford Ct Unit 11