6 March St Nashua, NH 03060
Southeast Nashua NeighborhoodEstimated Value: $489,000 - $537,000
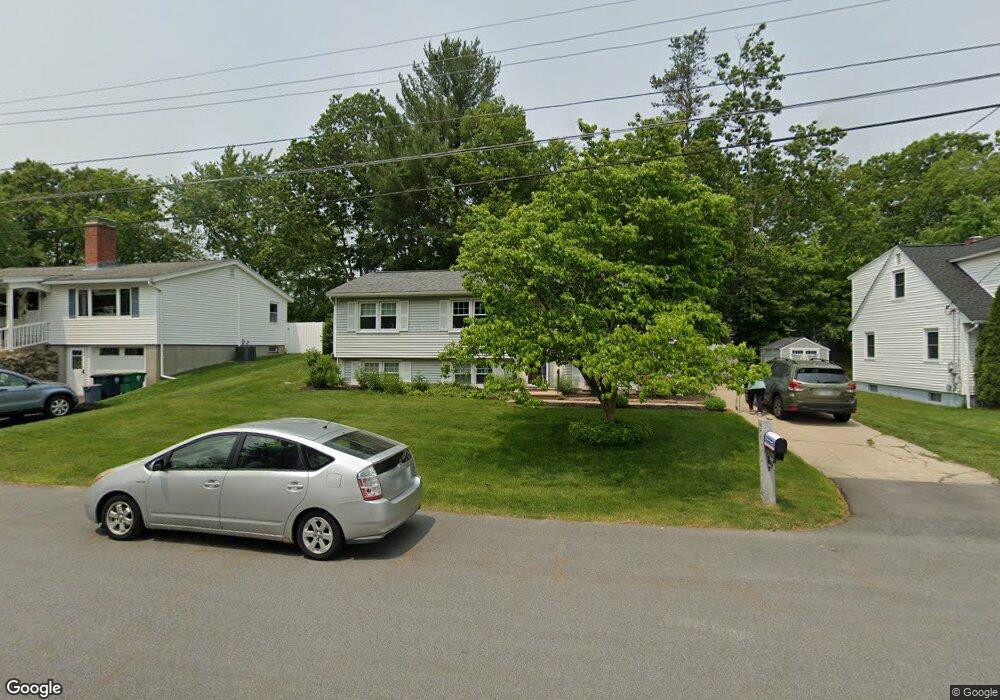
About This Home
This home is located at 6 March St, Nashua, NH 03060 and is currently estimated at $508,146, approximately $483 per square foot. 6 March St is a home located in Hillsborough County with nearby schools including Sunset Heights Elementary School, Elm Street Middle School, and Fairgrounds Middle School.
Ownership History
We collect this data history from publicly available records. To have your information removed, we recommend requesting removal directly through your county’s website.
Purchase Details
Purchase Details
Home Values in the Area
Average Home Value in this Area
Purchase History
We collect this data history from publicly available records. To have your information removed, we recommend requesting removal directly through your county’s website.
| Date | Buyer | Sale Price | Title Company |
|---|---|---|---|
| -- | None Available | ||
| $120,000 | -- |
Mortgage History
We collect this data history from publicly available records. To have your information removed, we recommend requesting removal directly through your county’s website.
| Date | Status | Borrower | Loan Amount |
|---|---|---|---|
| Previous Owner | $150,000 | ||
| Closed | $150,000 | ||
| Previous Owner | $120,000 |
Tax History
We collect this data history from publicly available records. To have your information removed, we recommend requesting removal directly through your county’s website.
| Year | Tax Paid | Tax Assessment Tax Assessment Total Assessment is a certain percentage of the fair market value that is determined by local assessors to be the total taxable value of land and additions on the property. | Land | Improvement |
|---|---|---|---|---|
| 2025 | $7,504 | $445,900 | $154,400 | $291,500 |
| 2024 | $7,090 | $445,900 | $154,400 | $291,500 |
| 2023 | $6,656 | $365,100 | $123,500 | $241,600 |
| 2022 | $6,597 | $365,100 | $123,500 | $241,600 |
| 2021 | $5,963 | $256,800 | $86,500 | $170,300 |
| 2020 | $5,770 | $255,200 | $86,500 | $168,700 |
| 2019 | $5,553 | $255,200 | $86,500 | $168,700 |
| 2018 | $5,413 | $255,200 | $86,500 | $168,700 |
| 2017 | $4,774 | $185,100 | $74,100 | $111,000 |
| 2016 | $4,640 | $185,100 | $74,100 | $111,000 |
| 2015 | $4,526 | $184,500 | $74,100 | $110,400 |
| 2014 | $4,437 | $184,500 | $74,100 | $110,400 |
Map
- 3 Eastbrook Dr
- 47 Farmington Rd
- 68 Farmington Rd
- 160 Daniel Webster Hwy Unit 201
- 37 Pike St
- 7 Autumn Leaf Dr Unit U24
- 7 Autumn Leaf Dr Unit 3
- 6 Autumn Leaf Dr Unit 20
- 3 Autumn Leaf Dr Unit 10
- 18 Bluestone Dr
- 26 Bluestone Dr
- 50 Spindlewick Dr
- 3 Mission Ln
- 21 Hayden St
- 27 Eastman St Unit 6062
- 14 Wentworth St
- 10 Wentworth St
- 85 Taylor St
- 1B E Dunstable Rd
- 4 Spindlewick Dr
Ask me questions while you tour the home.