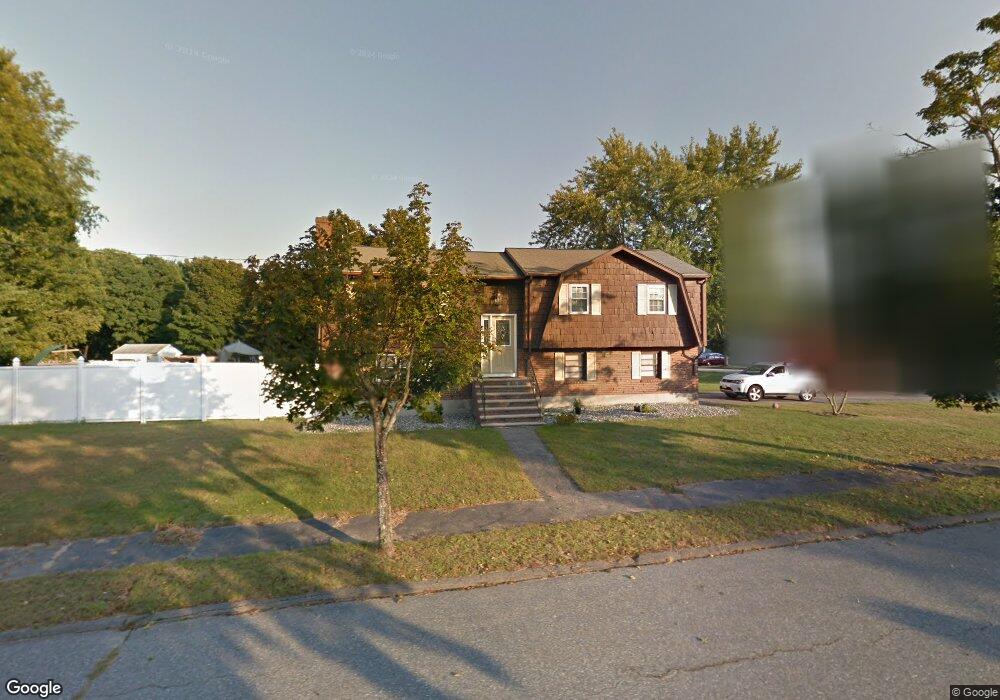
6 Marion Rd Peabody, MA 01960
West Peabody NeighborhoodEstimated Value: $769,000 - $865,000
4
Beds
3
Baths
2,304
Sq Ft
$359/Sq Ft
Est. Value
About This Home
This home is located at 6 Marion Rd, Peabody, MA 01960 and is currently estimated at $827,566, approximately $359 per square foot. 6 Marion Rd is a home located in Essex County with nearby schools including Peabody Veterans Memorial High School and Covenant Christian Academy.
Ownership History
Date
Name
Owned For
Owner Type
Purchase Details
Closed on
Mar 1, 2012
Sold by
Guiry James E and Guiry Elena M
Bought by
Guiry Elena M
Current Estimated Value
Home Financials for this Owner
Home Financials are based on the most recent Mortgage that was taken out on this home.
Original Mortgage
$302,000
Outstanding Balance
$207,552
Interest Rate
3.88%
Mortgage Type
New Conventional
Estimated Equity
$620,014
Purchase Details
Closed on
Jul 8, 2002
Sold by
Brand Leonard M and Brand Beverly L
Bought by
Guiry James E and Guiry Elena M
Create a Home Valuation Report for This Property
The Home Valuation Report is an in-depth analysis detailing your home's value as well as a comparison with similar homes in the area
Home Values in the Area
Average Home Value in this Area
Purchase History
| Date | Buyer | Sale Price | Title Company |
|---|---|---|---|
| Guiry Elena M | -- | -- | |
| Guiry James E | $344,000 | -- |
Source: Public Records
Mortgage History
| Date | Status | Borrower | Loan Amount |
|---|---|---|---|
| Open | Guiry James E | $302,000 | |
| Previous Owner | Guiry James E | $50,000 |
Source: Public Records
Tax History Compared to Growth
Tax History
| Year | Tax Paid | Tax Assessment Tax Assessment Total Assessment is a certain percentage of the fair market value that is determined by local assessors to be the total taxable value of land and additions on the property. | Land | Improvement |
|---|---|---|---|---|
| 2025 | $6,916 | $746,900 | $321,600 | $425,300 |
| 2024 | $6,435 | $705,600 | $321,600 | $384,000 |
| 2023 | $5,739 | $602,800 | $268,000 | $334,800 |
| 2022 | $5,897 | $583,900 | $233,100 | $350,800 |
| 2021 | $5,413 | $516,000 | $211,900 | $304,100 |
| 2020 | $5,490 | $511,200 | $211,900 | $299,300 |
| 2019 | $5,186 | $471,000 | $211,900 | $259,100 |
| 2018 | $5,054 | $441,000 | $189,200 | $251,800 |
| 2017 | $5,045 | $429,000 | $189,200 | $239,800 |
| 2016 | $4,832 | $405,400 | $189,200 | $216,200 |
| 2015 | $4,839 | $393,400 | $189,200 | $204,200 |
Source: Public Records
Map
Nearby Homes