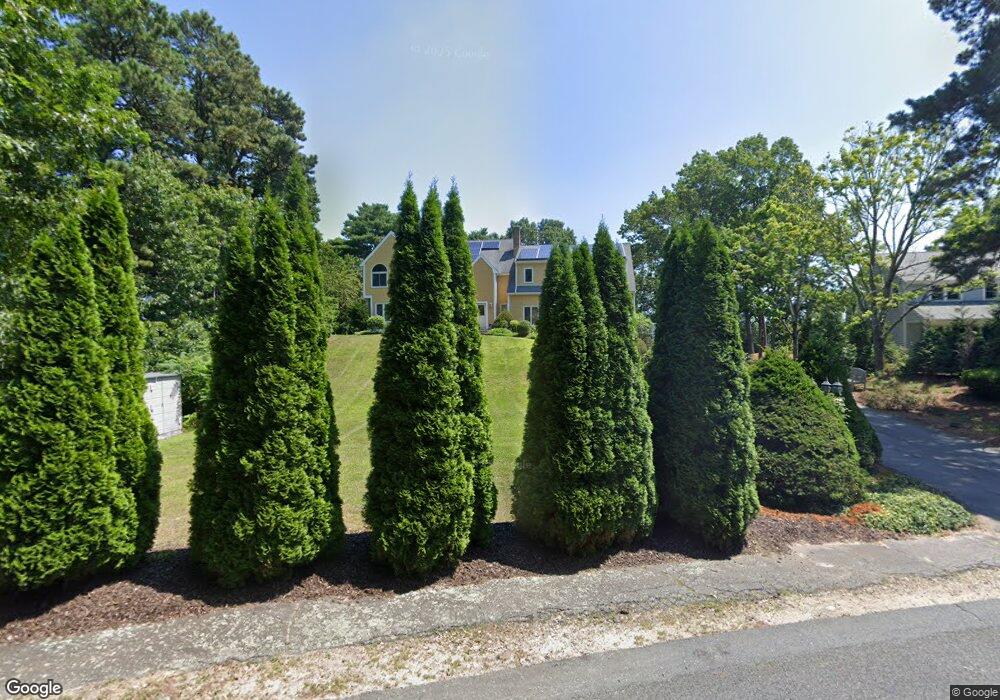
6 Marscot Way Plymouth, MA 02360
Estimated Value: $1,187,740 - $1,452,000
4
Beds
3
Baths
3,831
Sq Ft
$343/Sq Ft
Est. Value
About This Home
This home is located at 6 Marscot Way, Plymouth, MA 02360 and is currently estimated at $1,312,185, approximately $342 per square foot. 6 Marscot Way is a home located in Plymouth County with nearby schools including Federal Furnace Elementary School, Plymouth Community Intermediate, and Plymouth North High School.
Ownership History
Date
Name
Owned For
Owner Type
Purchase Details
Closed on
Apr 21, 2006
Sold by
Mendes Robert J and Mendes Linda L
Bought by
Mcavennie Patrick and Mcavennie Miroslava
Current Estimated Value
Home Financials for this Owner
Home Financials are based on the most recent Mortgage that was taken out on this home.
Original Mortgage
$526,000
Interest Rate
6.37%
Mortgage Type
Purchase Money Mortgage
Purchase Details
Closed on
Dec 27, 2002
Sold by
Reardon William E and Reardon Janice Lee
Bought by
Mendes Robert J and Mendes Linda L
Purchase Details
Closed on
Dec 18, 1992
Sold by
Knudsen Kenneth R and Knudsen Janet V
Bought by
Reardon William E and Reardon Janice L
Purchase Details
Closed on
Jun 22, 1990
Sold by
Ciancia Thomas R
Bought by
Knudsen Kenneth R
Create a Home Valuation Report for This Property
The Home Valuation Report is an in-depth analysis detailing your home's value as well as a comparison with similar homes in the area
Home Values in the Area
Average Home Value in this Area
Purchase History
| Date | Buyer | Sale Price | Title Company |
|---|---|---|---|
| Mcavennie Patrick | $657,500 | -- | |
| Mendes Robert J | $560,000 | -- | |
| Reardon William E | $275,000 | -- | |
| Knudsen Kenneth R | $425,000 | -- |
Source: Public Records
Mortgage History
| Date | Status | Borrower | Loan Amount |
|---|---|---|---|
| Open | Knudsen Kenneth R | $727,000 | |
| Closed | Knudsen Kenneth R | $526,000 |
Source: Public Records
Tax History Compared to Growth
Tax History
| Year | Tax Paid | Tax Assessment Tax Assessment Total Assessment is a certain percentage of the fair market value that is determined by local assessors to be the total taxable value of land and additions on the property. | Land | Improvement |
|---|---|---|---|---|
| 2025 | $15,039 | $1,185,100 | $288,100 | $897,000 |
| 2024 | $14,515 | $1,127,800 | $273,700 | $854,100 |
| 2023 | $13,955 | $1,017,900 | $249,700 | $768,200 |
| 2022 | $12,776 | $828,000 | $225,300 | $602,700 |
| 2021 | $12,894 | $797,900 | $225,300 | $572,600 |
| 2020 | $12,833 | $784,900 | $213,300 | $571,600 |
| 2019 | $12,668 | $765,900 | $189,300 | $576,600 |
| 2018 | $9,685 | $588,400 | $177,300 | $411,100 |
| 2017 | $9,106 | $549,200 | $177,300 | $371,900 |
| 2016 | $8,892 | $546,500 | $171,300 | $375,200 |
| 2015 | $8,451 | $543,800 | $165,300 | $378,500 |
| 2014 | $8,052 | $532,200 | $165,300 | $366,900 |
Source: Public Records
Map
Nearby Homes