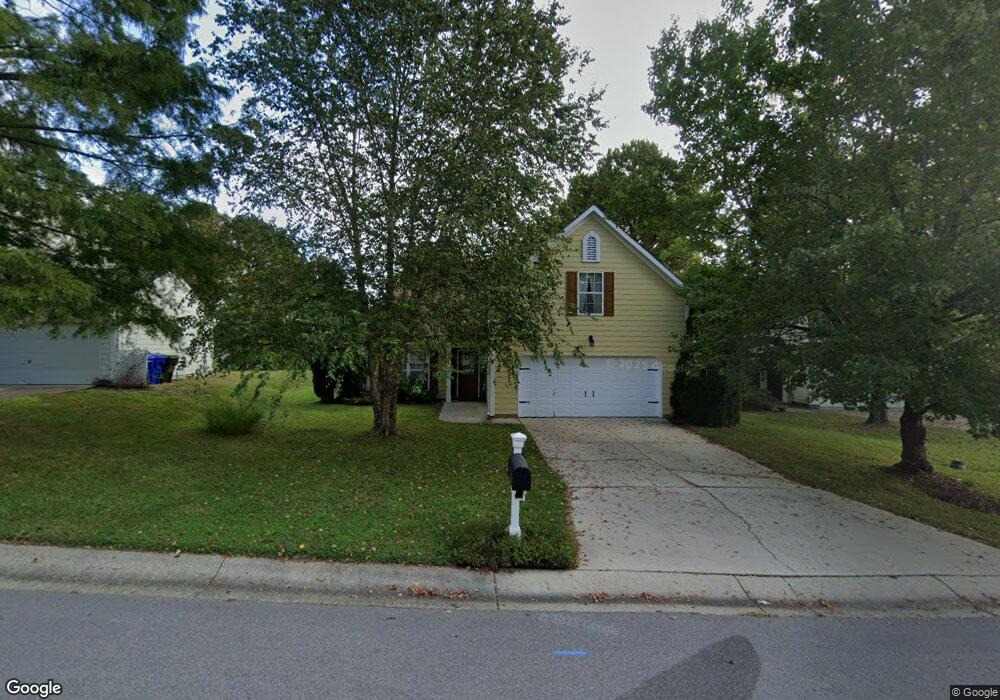
6 Marsh Landing Ct Durham, NC 27703
Eastern Durham NeighborhoodEstimated Value: $406,000 - $433,000
3
Beds
2
Baths
2,120
Sq Ft
$196/Sq Ft
Est. Value
About This Home
This home is located at 6 Marsh Landing Ct, Durham, NC 27703 and is currently estimated at $415,752, approximately $196 per square foot. 6 Marsh Landing Ct is a home located in Durham County with nearby schools including Oak Grove Elementary, John W Neal Middle School, and Southern School of Energy & Sustainability.
Ownership History
Date
Name
Owned For
Owner Type
Purchase Details
Closed on
Sep 29, 1998
Sold by
D R Horton Inc Torrey
Bought by
Smith Amy M and Smith Edward J
Current Estimated Value
Home Financials for this Owner
Home Financials are based on the most recent Mortgage that was taken out on this home.
Original Mortgage
$160,750
Outstanding Balance
$94,824
Interest Rate
5.87%
Estimated Equity
$320,928
Create a Home Valuation Report for This Property
The Home Valuation Report is an in-depth analysis detailing your home's value as well as a comparison with similar homes in the area
Home Values in the Area
Average Home Value in this Area
Purchase History
| Date | Buyer | Sale Price | Title Company |
|---|---|---|---|
| Smith Amy M | $169,500 | -- |
Source: Public Records
Mortgage History
| Date | Status | Borrower | Loan Amount |
|---|---|---|---|
| Open | Smith Amy M | $160,750 |
Source: Public Records
Tax History
| Year | Tax Paid | Tax Assessment Tax Assessment Total Assessment is a certain percentage of the fair market value that is determined by local assessors to be the total taxable value of land and additions on the property. | Land | Improvement |
|---|---|---|---|---|
| 2025 | $3,966 | $400,114 | $66,869 | $333,245 |
| 2024 | $3,306 | $237,020 | $43,773 | $193,247 |
| 2023 | $3,105 | $237,020 | $43,773 | $193,247 |
| 2022 | $3,034 | $237,020 | $43,773 | $193,247 |
| 2021 | $3,019 | $237,020 | $43,773 | $193,247 |
| 2020 | $2,948 | $237,020 | $43,773 | $193,247 |
| 2019 | $2,948 | $237,020 | $43,773 | $193,247 |
| 2018 | $2,779 | $204,847 | $42,152 | $162,695 |
| 2017 | $2,758 | $204,847 | $42,152 | $162,695 |
| 2016 | $2,665 | $204,847 | $42,152 | $162,695 |
| 2015 | $2,944 | $212,700 | $36,551 | $176,149 |
| 2014 | $2,944 | $212,700 | $36,551 | $176,149 |
Source: Public Records
Map
Nearby Homes
- 501 Bellmeade Bay Dr
- 604 Bellmeade Bay Dr
- 411 Bellmeade Bay Dr
- 615 Southshore Pkwy
- 4 Jarvis Ct
- 3908 Holder Rd
- 701 Painted Daisy Ln
- 3023 Allamore Dr
- 3013 Allamore Dr
- 907 Danbury Dr
- 601 Crossing Dr
- 928 Danbury Dr
- 110 Kindlewood Dr
- 210 Stoney Creek Cir
- 442 Gus Rd
- 1107 High Fox Dr
- 407 Glenview Ln
- 107 Crosswood Dr
- 610 Sherron Rd
- 1015 Sora Way
- 4 Marsh Landing Ct
- 8 Marsh Landing Ct
- 2 Marsh Landing Ct
- 505 Bellmeade Bay Dr
- 12 Marsh Landing Ct
- 603 Bellmeade Bay Dr
- 5 Marsh Landing Ct
- 503 Bellmeade Bay Dr
- 7 Marsh Landing Ct
- 605 Bellmeade Bay Dr
- 9 Marsh Landing Ct
- 807 Southshore Pkwy
- 809 Southshore Pkwy
- 506 Bellmeade Bay Dr
- 807 Southshore Pkwy
- 805 Southshore Pkwy
- 602 Bellmeade Bay Dr
- 504 Bellmeade Bay Dr
- 415 Bellmeade Bay Dr
- 112 Lake Valley Ln
Your Personal Tour Guide
Ask me questions while you tour the home.